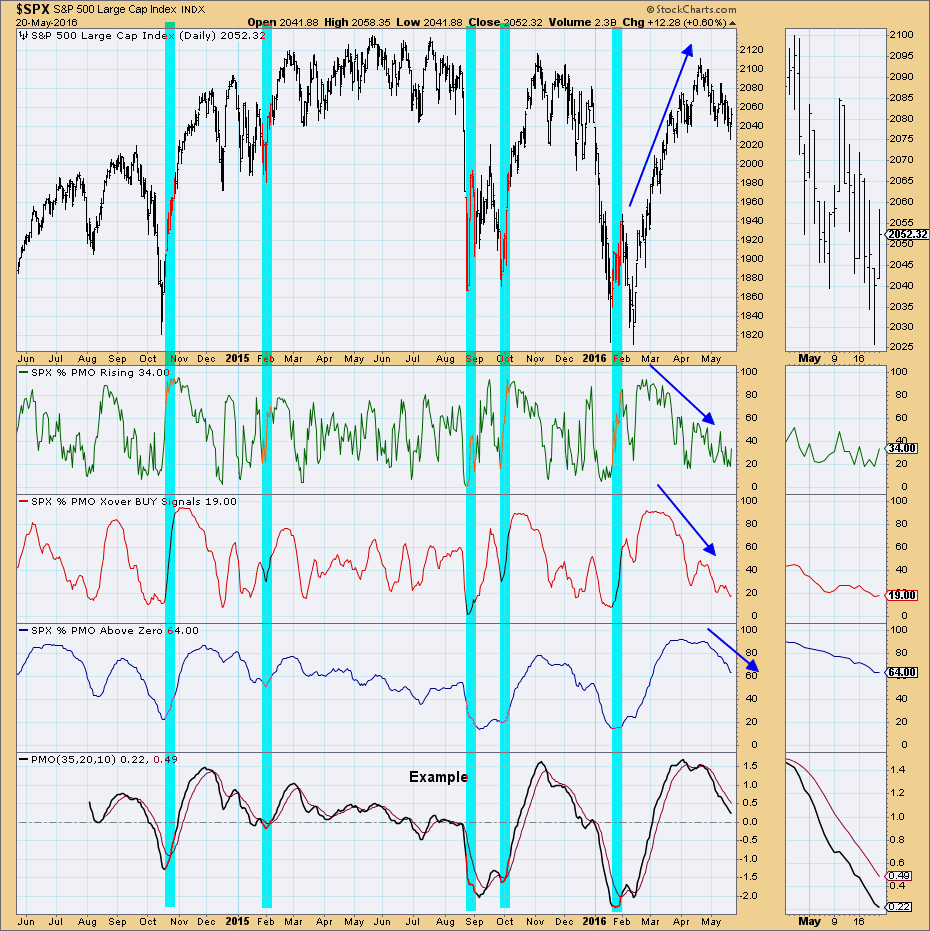
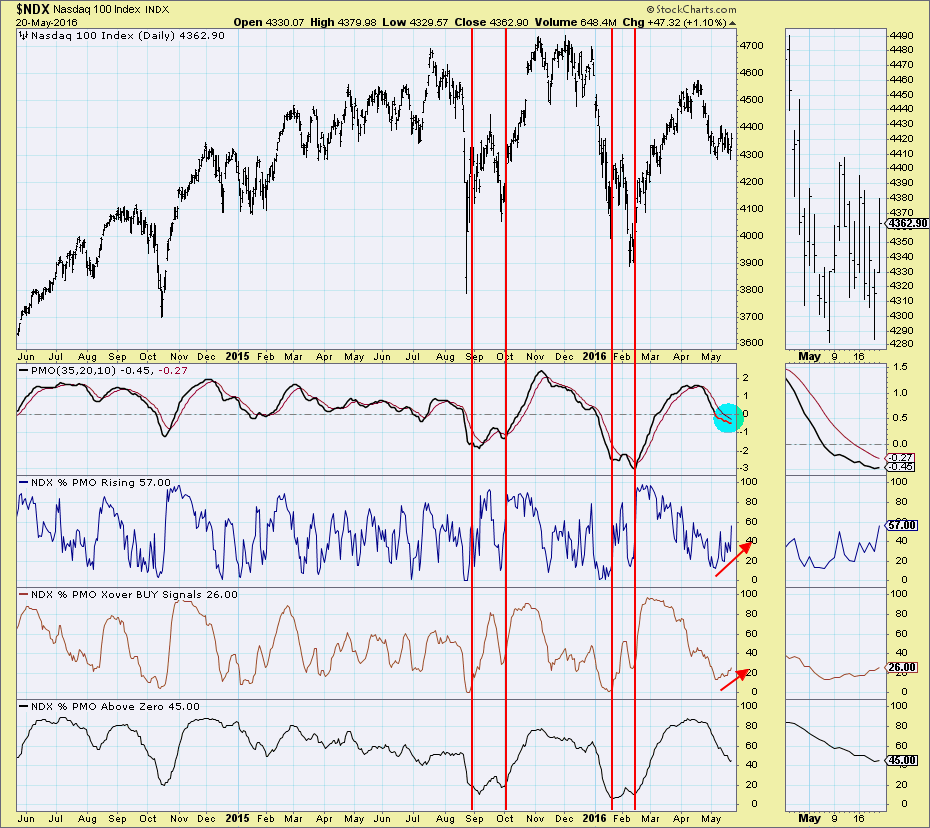
During today's webinar, my "Bonus Indicator Chart" was the Price Momentum Oscillator (PMO) Analysis chart for the SPX. It reveals that it doesn't have the internal strength necessary (yet) to rally out of the current declining trend. The NDX is beginning to show signs of life. Comparing these two charts will give us insight on what preparations are needed to support a new rally.
Trouble was brewing over the Spring. Price was climbing higher, but PMO Buy signals and % of PMOs Rising were in decline. What we need to see based on previous price bottoms that resulted in strong rallies, is improvement internally for the members of the SPX. In the short term, PMOs need to be turning up and bottoming, this would improve the first indicator pane. For the intermediate term, more PMOs should not only be rising, but they need to start having positive crossover BUY signals. PMOs that are above zero show sustained positive momentum and in the long term, components should be on sustained long-term price rises that would result in positive PMO readings.
There are signs of life for the NDX. The % PMO Rising in the NDX is beginning to trend up, as is the % PMO Crossover BUY Signals. No improvement on the % PMOs Above Zero yet. When that indicator begins to bottom, we can look for a rally. You should also note, that the PMO for the NDX is attempting to bottom. One big negative for the NDX is the reverse flag formation. That is a bearish pattern and would call for a breakdown that could test lows around 400. Internally, this PMO Analysis chart is bullish for the NDX.
Conclusion: The PMO Analysis charts for the SPX and NDX display the progression to look for to set-up a significant market bottom. The NDX which has been very weak against the other indexes is showing signs of life as its components begin to have rising PMOs and begin producing PMO BUY signals.
Come check out the DecisionPoint Report with Erin Heim on Wednesdays and Fridays at 7:00p EST, a fast-paced 30-minute review of the current markets mid-week and week-end. The archives and registration links are on the Homepage under “What’s New”.
Technical Analysis is a windsock, not a crystal ball.
Happy Charting!
- Erin


