Here we go again.
It seems as though every time the S&P 500 challenges the 2100 level and its all-time high close (2131), another aggressive area of the market falls apart and the rally is not sustainable. Below is a two year weekly chart of the S&P 500 where you can visualize these relative breakdowns one by one:
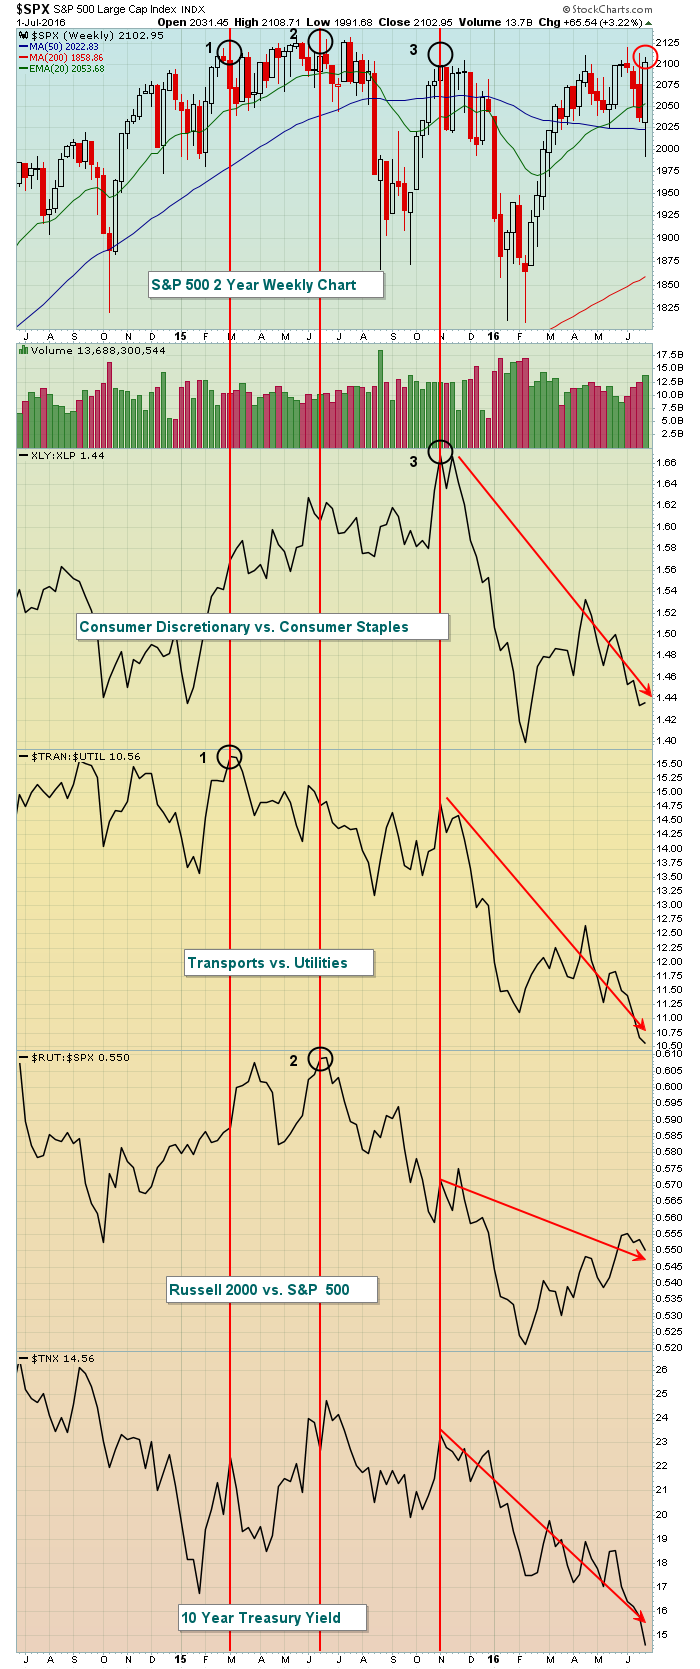 The three black circles highlight relative tops in the XLY:XLP, TRAN:UTIL and RUT:SPX at various stages of the bull market. The red circle shows the current S&P 500 price with the corresponding deterioration of nearly every aggressive aspect of the market highlighted with downtrend lines. In other words, traders are RUNNING for safety, not walking. This is not the typical market behavior that precedes a major market breakout. In fact, I'd say the opposite is true. Rotation into safety generally occurs just before a market decline.
This is how the above chart looked at the October 2007 high and prior to the last bear market:
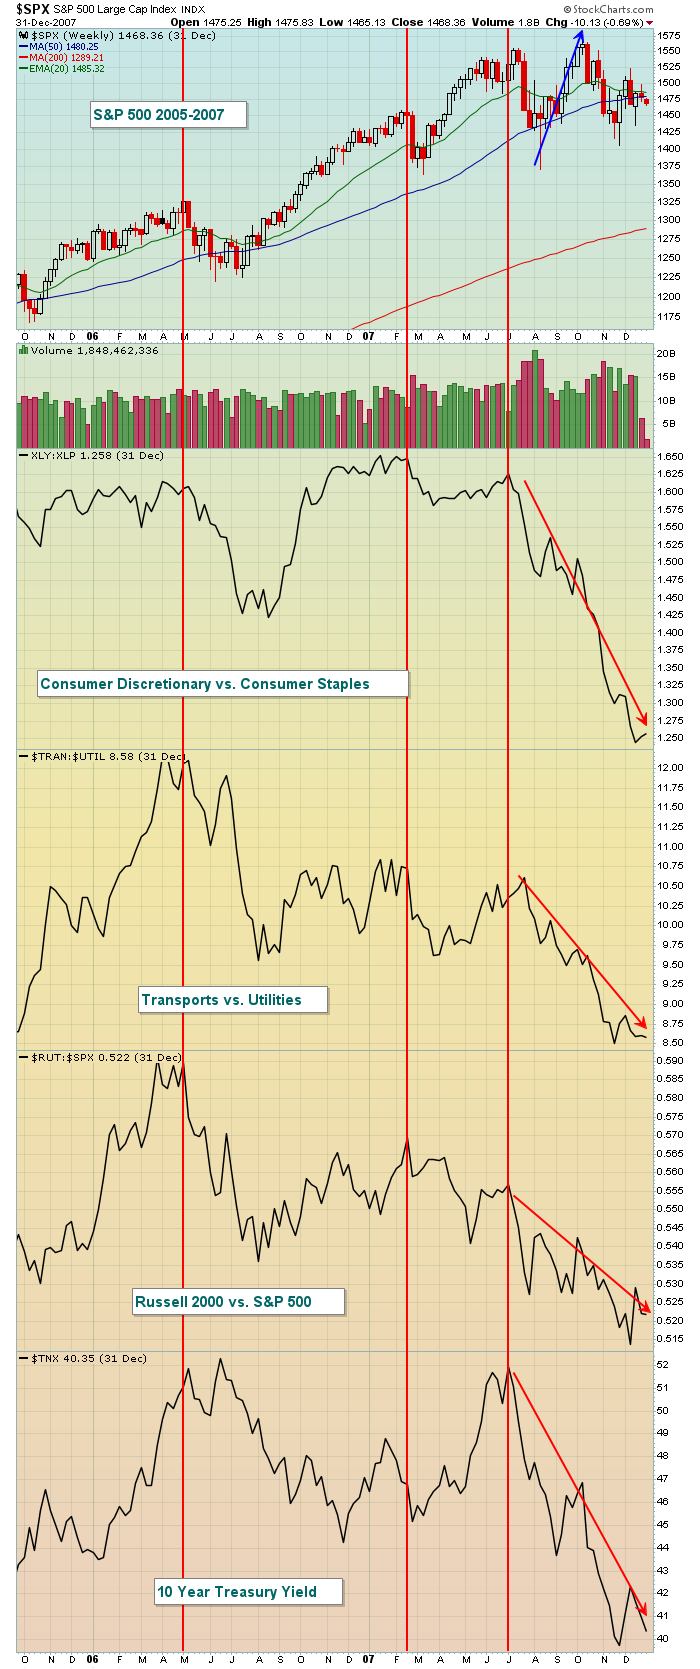 Note how the S&P 500 made a price breakout in October 2007, but there was little support for the breakout in terms of rotation towards aggressive areas of the market. In fact, look at the relative strength disintegration in the final weeks of that bull market. Traders turned to safety to lead the S&P 500 to one more final top. That looks a lot like what we're seeing in 2016. Furthermore, the worst historical period for the S&P 500 (since 1950) is from July 17th through September 27th and we're approaching that time frame.
I'm going to make a bold prediction. I believe the U.S. stock market will make a very meaningful top over the next two weeks and could potentially see a significant drop over the summer and into the presidential election. That's what market participants appear to be bracing for. Obviously, a closing high above 2131 on the S&P 500 will require a re-evaluation. Until then, however, I'd be very cautious.
Happy trading!
Tom
