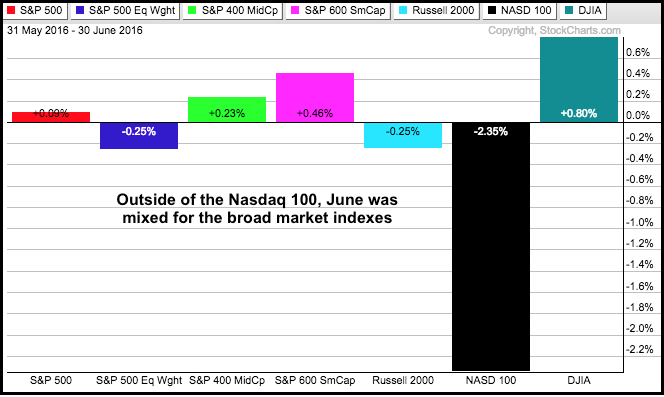
Chartists will look back at the long-term charts and try to figure out where exactly this big Brexit panic actually occurred. Was there even such an event? There is something to be said for monthly close-only charts because they filter a lot of noise, and June was definitely a month with lots of noise. Despite some volatile swings, the major indexes ended the month with little change. Outside of the Nasdaq 100, the monthly gains and losses were between +1% and -1%. The Dow Industrials led and the Nasdaq 100 lagged. In a rare divergence, the S&P Small-Cap 600 was up a fraction and the Russell 2000 was down.
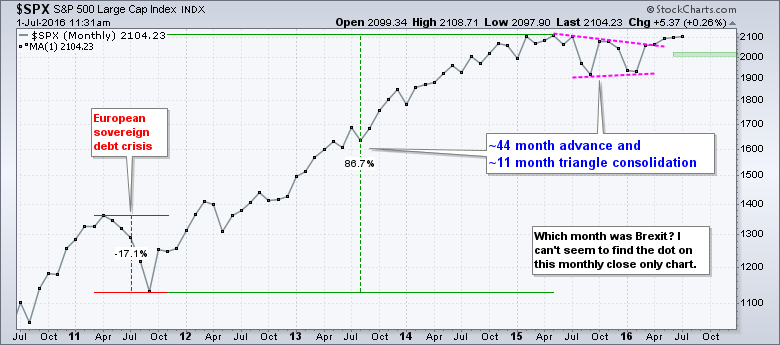
The next chart shows monthly closing prices for the S&P 500. At the risk of over simplification, the trend and the pattern at work seem obvious to me. After falling some 17% in 2011, the index embarked on a 44 month advance that gained over 85%. $SPX was certainly entitled to a rest after such a strong advance and the triangle consolidation provided this rest. At 11 months, the consolidation is around a quarter as long as the prior advance, which seems reasonable. Most importantly, the index broke above the upper trend line with the April close and held this breakout the next two months. This breakout means the uptrend is resuming and the index is now less than 2% from its all time high. I would not become concerned with the long-term uptrend unless the index closes below 2000.
****************************************
Thanks for tuning in and have a good weekend!
--Arthur Hill CMT
Plan your Trade and Trade your Plan
*****************************************


