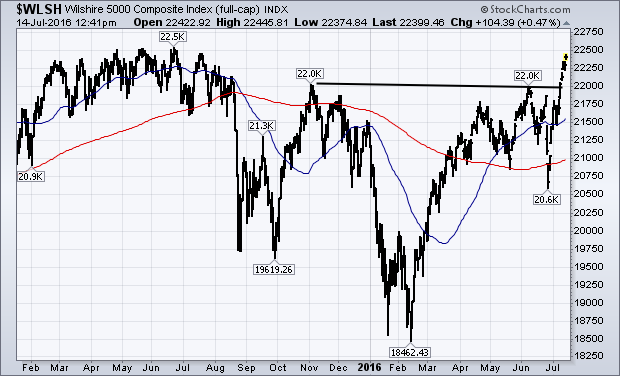
The Dow Industrials and S&P 500 continue to hit record highs. I've been showing upside breakouts in other parts of the market that include small caps and the NYSE Composite Index. Here's another one. Chart 3 shows the Wilshire 5000 Composite Index ($WLSH) having risen above its November/June highs to initiate a new uptrend. The WLSH is the broadest measure of the U.S. market (and includes more smaller and midsize stocks). It's now heading for a test of its old highs.
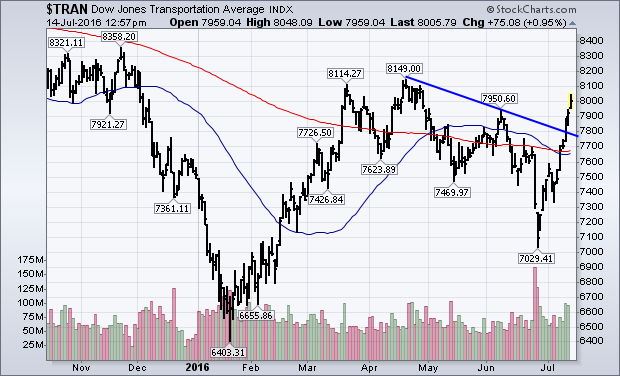
 With the Dow Industrials having exceeded their 2015 high to reach a new record, chartists are taking some encouragement from the recent upturn in the Dow Transports. According the Dow Theory, an upturn in one of them needs to be confirmed by upturn in the other. The Transports aren't anywhere near their old highs. They are, however, approaching a test of their spring highs. An upside breakout there would make Dow Theorists feel a lot better about the market rally. Chart 4 shows the Dow Transports surging to a two-month high this week on rising volume. It's nearing a test of its April high. A close over that peak would put both Dow Averages in uptrends. The recent rise has been driven by airlines and rails.