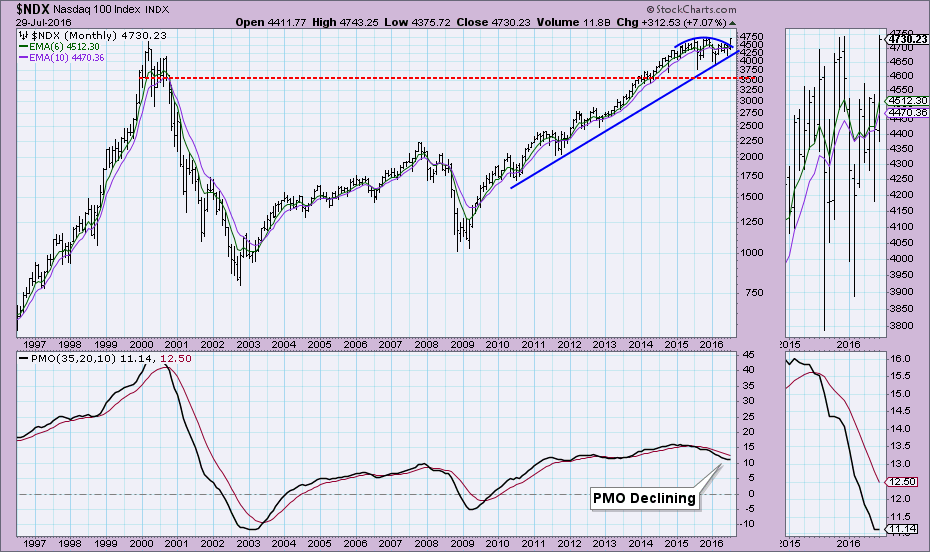
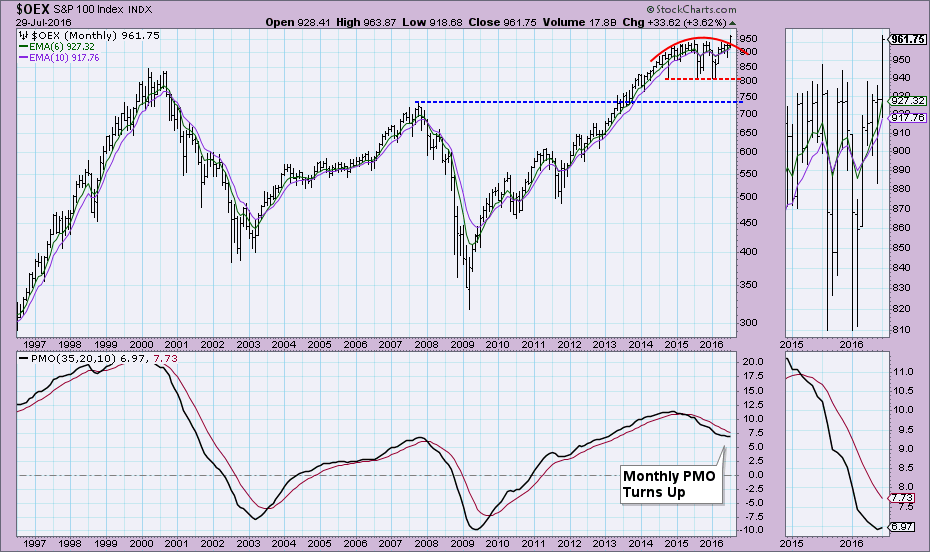
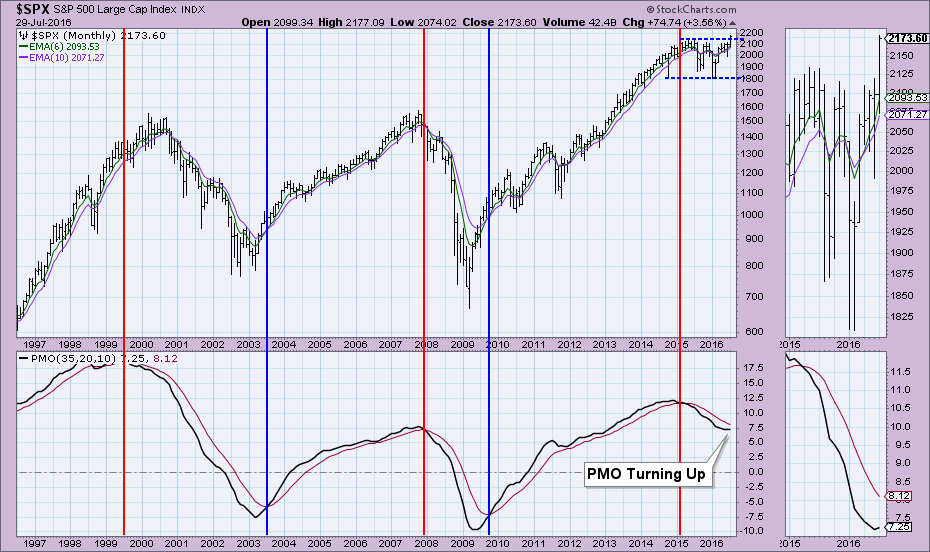
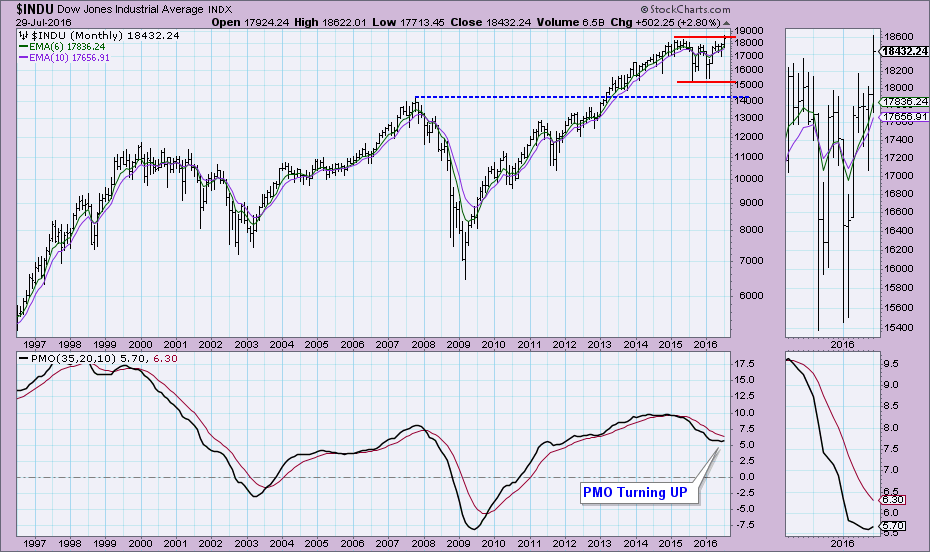
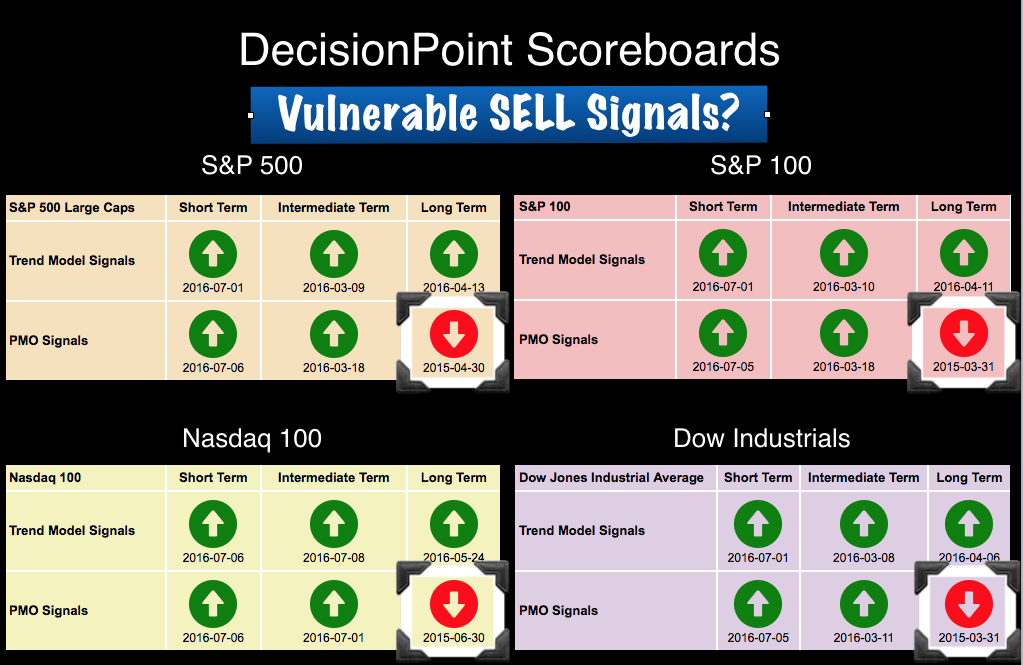
 The DecisionPoint Scoreboards stopped changing on July 8th as the final BUY signal was added to the Nasdaq 100's Scoreboard. The question is how much longer before the other four SELL signals are erased? The Long-Term Price Momentum Oscillator (PMO) Signal is generated on the monthly charts which went final today. Let's review the four Scoreboard indexes monthly charts and see where they stand. The long-term picture for these monthly PMOs is getting bullish.
The Nasdaq 100 has had a great month. However, it wasn't good enough to turn its monthly PMO up. It did decelerate which is bullish, but overall the monthly PMO is considered negative as it declines and is below its signal line. On the other hand, the price pattern is very bullish. The NDX pulled out of a very bearish rounded top and hit all-time highs. The 6-month EMA is now back above the 10-month EMA so we will likely see the monthly PMO, which has decelerated already, turn up if the NDX has another favorable month.
The price pattern for the OEX is similar with a nice breakout from the bearish rounded top. Unlike the NDX, the PMO on the OEX has turned up.
Same story for the SPX. I've annotated the crossovers that have occurred in the last 20 years. There aren't many, so when they arrive we do need to pay attention.
The Dow only barely made it above its all-time price highs, but it made them nonetheless. The monthly PMO also turned up on the Dow.
Conclusion: The monthly PMOs, except on the NDX, have all bottomed. As seen on the SPX monthly chart, those signals happen rarely but should be heeded. Though long-term positive momentum may be building, it will take a sustained bull market rally for the signal to change. Monthly PMO tops and bottoms are useful as attention flags, but plenty can happen in a month to change the picture dramatically.
Come check out the DecisionPoint Report with Erin Heim on Wednesdays and Fridays at 7:00p EST, a fast-paced 30-minute review of the current markets mid-week and week-end. The archives and registration links are on the Homepage under “What’s New”.
Technical Analysis is a windsock, not a crystal ball.
Happy Charting!
- Erin

