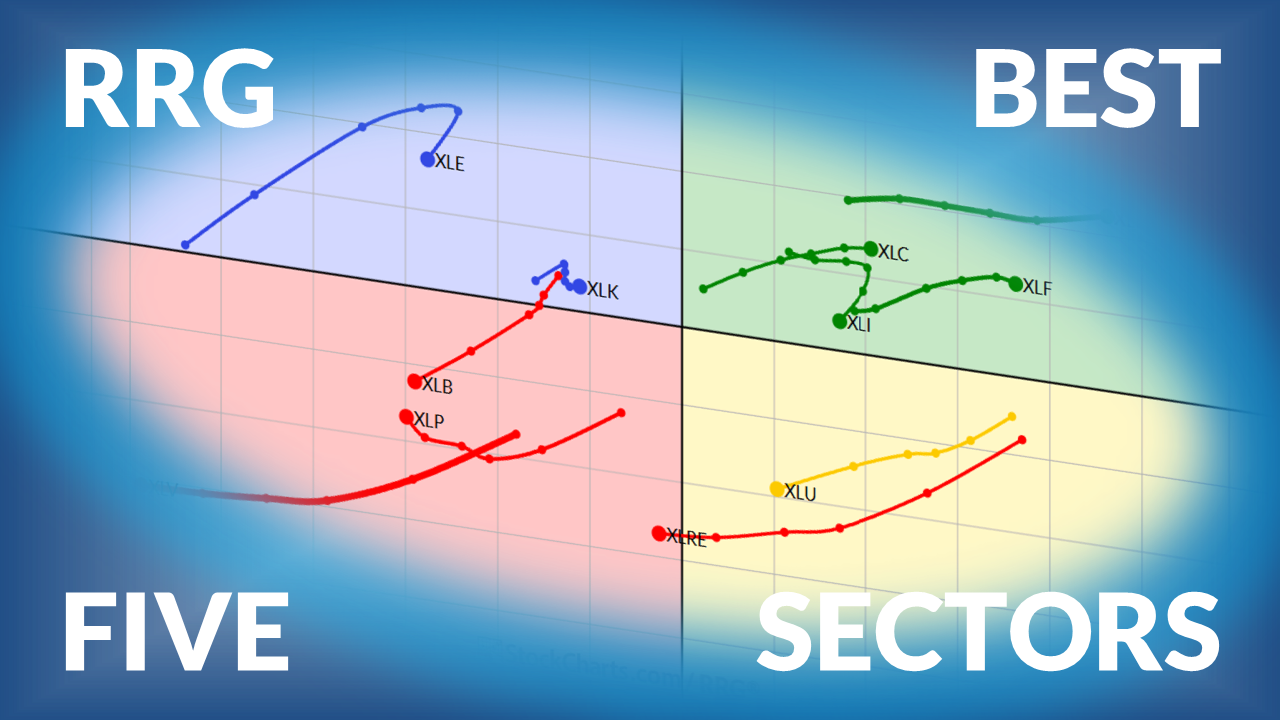
Combining Seasonality And Strong Technical Patterns
This is the final ChartWatchers newsletter before all of us here at StockCharts.com descend upon Northern California to produce what I believe will be one of the most educational online financial conferences of our time. Leading technical experts will be divulging their best kept secrets to hopefully add weapons to your arsenal as you trade and invest for higher profits. You still have time to register, but that window is closing FAST! A small investment in education can go a long way toward higher profits, so please be sure to check out our information page. That page lists the speakers - and the time(s) they'll present - and the agenda, along with REGISTRATION information. I've been to a large number of financial conferences and believe this one will BY FAR exceed the educational content of all of my prior conferences combined.
I am a true historian and have witnessed historical trends repeat themselves over and over and over again. In April, I posted a ChartWatchers article, "Where Should We Look For May Strength?". I promptly pointed out that the Dow Jones U.S. Tobacco Index ($DJUSTB) produced its second largest gains during the month of May (October is its best), where it's averaged gaining 3.9% over the prior 17 years. In May 2016, the DJUSTB rose just 1.0%, but the trade setup was appropriately identified on its weekly chart. Here's how the DJUSTB looked at the time of that article (April 16th):
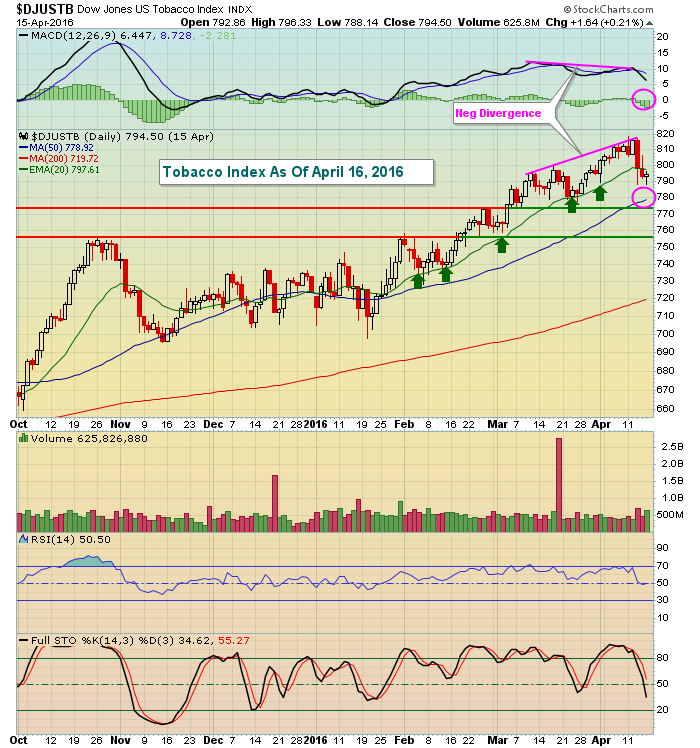
Technically, tobacco stocks were losing upward momentum in early April. As long as the MACD climbed in prior months, note that the rising 20 day EMA (green arrows) provided solid support. But that changed in April and a negative divergence emerged. Following that negative divergence and at the time of that ChartWatchers article, the rising 20 day EMA was lost, increasing the likelihood that we'd see a 50 day SMA test and potentially a MACD centerline reset (pink circles). Also keep in mind that we knew that tobacco performed well in May so we're trying to get the best reward to risk entry point into this group. In addition to the 50 day SMA, two price support lines are provided above. This is a solid explanation on how to plan a trade in advance on weakness, rather than chasing prices higher.
Now check out how tobacco performed once it bottomed later in April as expected:
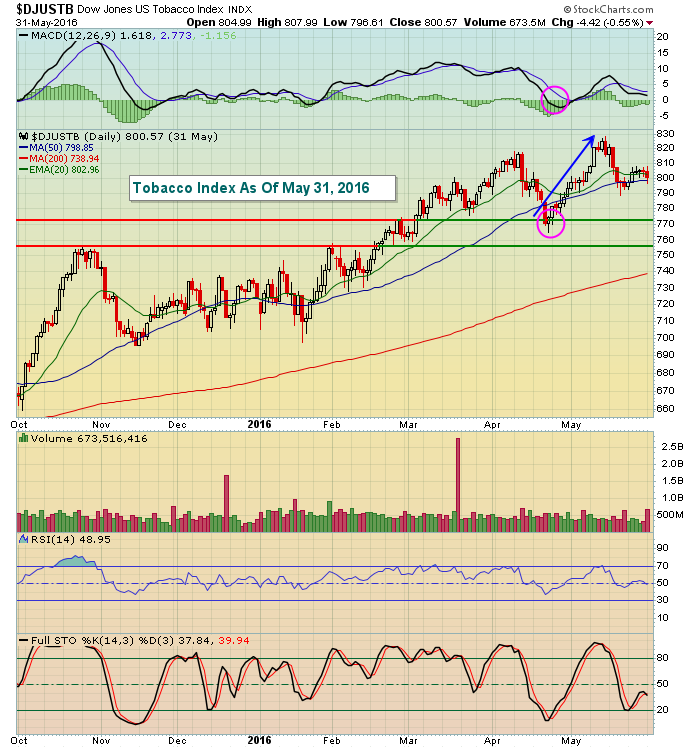
This chart shows the next six weeks of activity. We did see further weakness because of the momentum issues, but check out the quick recovery in tobacco stocks as they moved from April into May! While you could have made this trade based on technical indicators alone, the fact that May typically produces strong seasonal results for tobacco added to the likelihood of a successful trade here. Historical strength would increase my confidence in the trade, not guarantee its results.
During ChartCon 2016, my presentation is titled "Making Money From Repeating Historical Trends". During my discussion, I'll provide interesting facts about both the "Go Away In May" theory and stock market performance around presidential cycles. That will be followed up with very interesting and repeating trends regarding how U.S. equities trade throughout the calendar month. If you don't know that these trends exist, you're leaving profits on the table - it's as simple as that. I'll walk you through how use this seasonal information in a case study or two similar to the tobacco trade above. I hope you'll join all of us at StockCharts.com for a one-of-a-kind event. CLICK HERE to register!!!!
Happy trading and see you this week when we stream ChartCon 2016 LIVE to your office or living room!!!!
Tom