The Grocery chains are usually a free cash flow machine and are in the Consumer Staples Group. Walmart is an exception sitting in the Consumer Cyclicals group. Walmart started as a Broadline Retailer and added groceries.
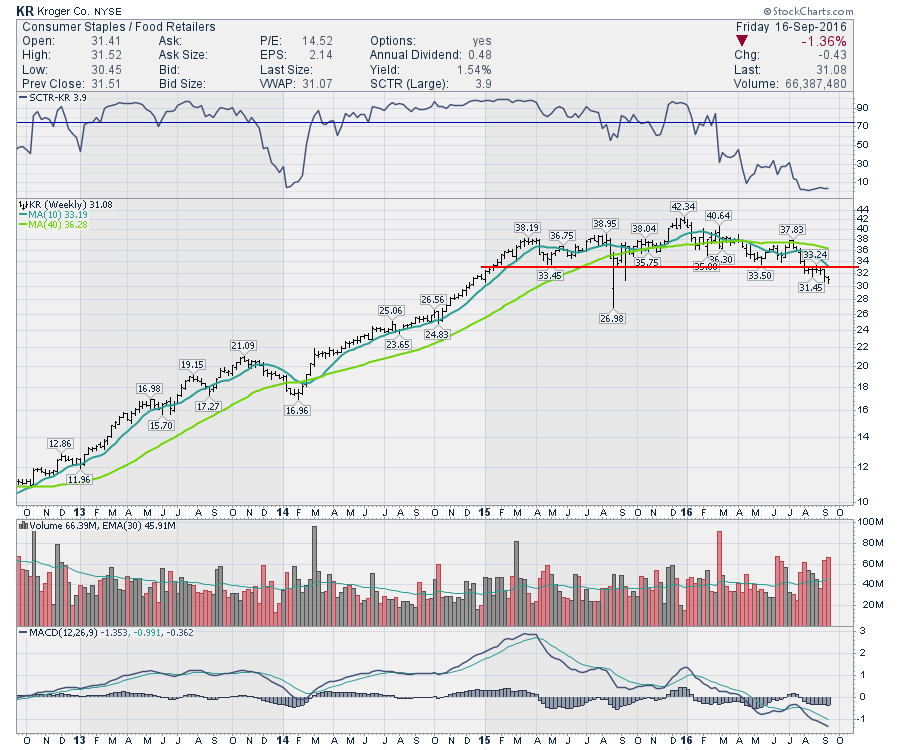
However, the grocers are not having a good year and major support levels are in play. Kroger (KR) is an example. After being in a fabulous uptrend through 2013-2014, Kroger went sideways in 2015 and is breaking support in September 2016. One could argue they broke support in August, but they are now surging away from that level. Either way, the chart looks broken. With an SCTR of 3.9%, this looks dismal. The fact that the SCTR has been weakening since the beginning of the year may just reflect the bounce in all the other sectors. My main concern with this chart is that the lower commodity prices are starting to filter into the grocers are their revenues are declining as eggs, beef and milk get cheaper.
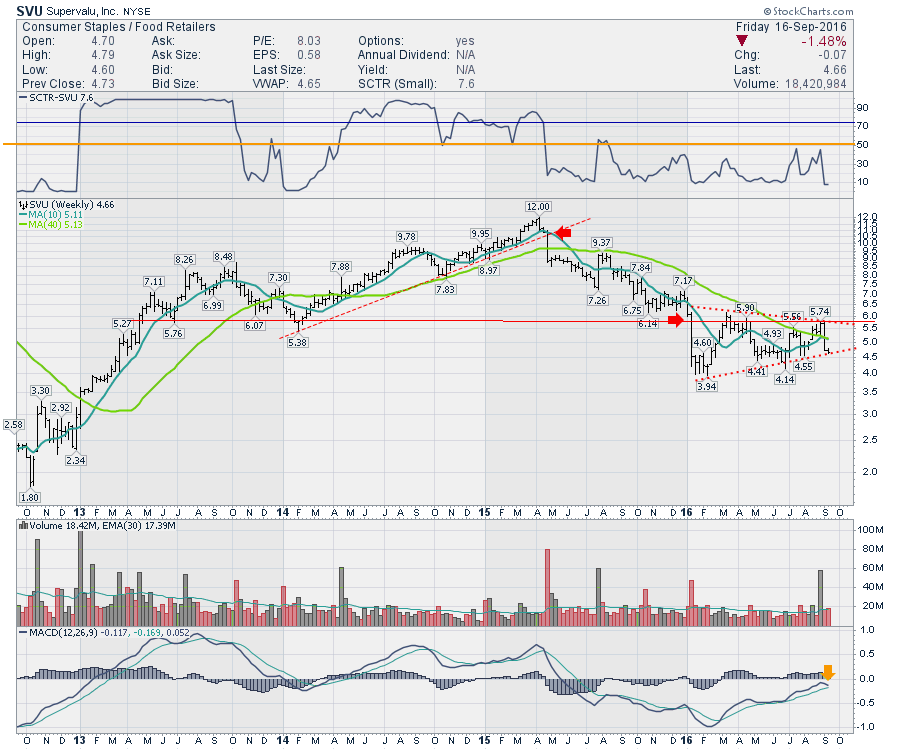
Looking at SuperValu (SVU), the trend has been broken for a long time. The most recent 2016 pennant is threatening to the downside as it back tested the support level of $5.75 and failed recently. Since the $12 highs, this stock has fallen 65 % and continues to underperform with a series of lower highs through 2015-2016.
 Walmart (WMT) looks a little better with their broad diversification. But the chart is piling up the technical points of review for Walmart's price action. First of all, I expanded this chart to 10 years. This shows Walmart since the StockCharts SCTR was started. The SCTR on Walmart has an interesting history. In both of the 2007 and 2011 broader market downtrends, the SCTR soared above 50 and stayed there during the downturns. This would reflect Walmart as a safe place during market downturns. In 2014, Walmart broke out to meaningful highs with the broad market which is shown in the lowest panel. When they announced their minimum wage increase, the stock fell hard. What is interesting now, is Walmart's SCTR has stayed above 50 for most of 2016. So I am watching to see if it renews the status of safe harbour in a storm (2007,2011) or will it continue to rise with the market in general (2014, 2016). The recent thrust with the market pullback makes me wonder.
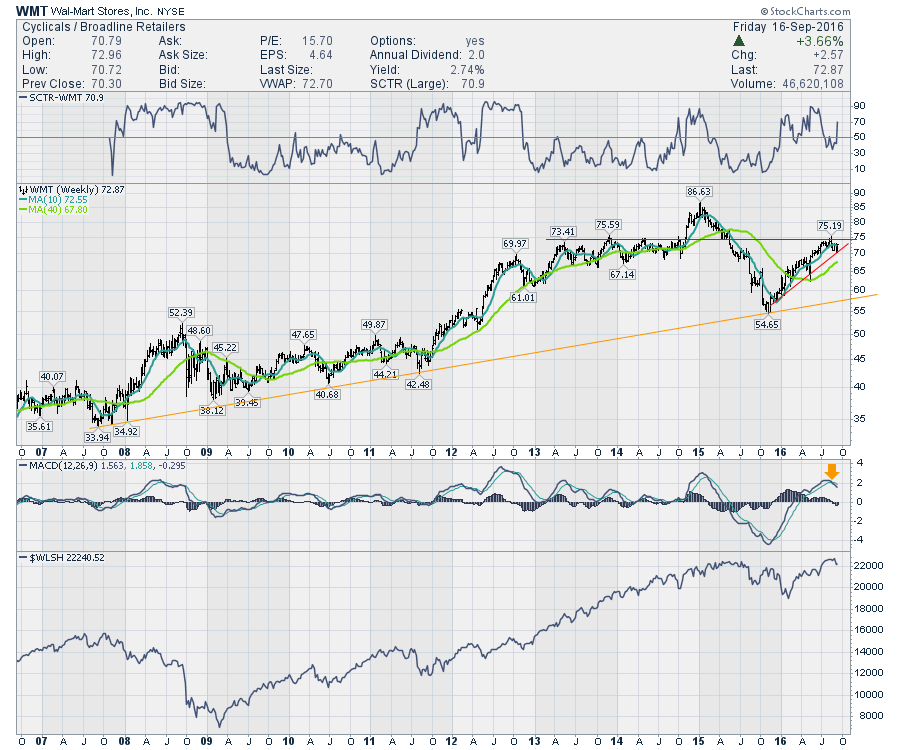 Looking at Walmart's price action, it is up against the major resistance of 2013-2014. It is also testing the 2016 up sloping trend line which just so happens to coincide with the 2013-2014 resistance level. Call it $70-$75 for an important battleground. For technicians, this is an important place on the chart. Looking at the MACD, when WMT gets up to this high level it is usually a meaningful top. If Walmart rolls over here, that would be an important long-term trend resistance and the orange uptrend would become important.
The other grocers are already struggling. Will Walmart follow suit? Will the defensive stocks start to rise up again? All three charts above need to get going to the upside or this group could experience a lot of selling pressure. Whole Foods (WFM) is barely holding at support. Investors in this sector should be aware of the knife-edge they sit on currently.
Good trading,
Greg Schnell, CMT, MFTA.