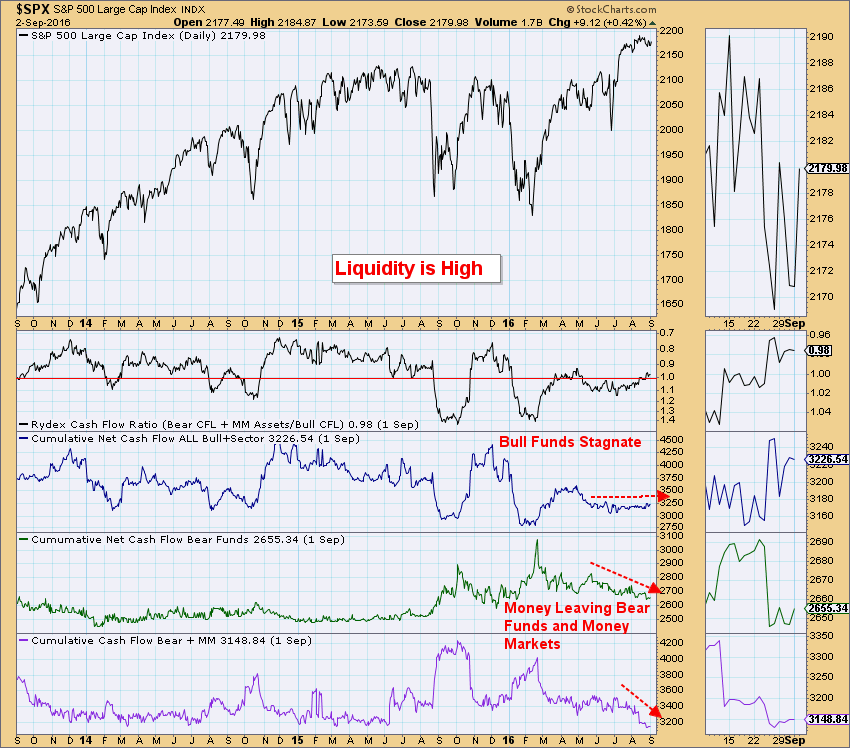
Liquidity can be equated to the availability of money. In terms of the market, when there is money on the sidelines, it is available for investing and could boost the market when/if it is invested. There are many measures, but I like using the Rydex Cashflow Ratio chart as a gauge.
Rydex has a set of mutual funds that work well for this. There are bear funds, money market assets and bull funds that are tracked and updated nightly. The cashflow chart shows us which direction the money is flowing and the ratio gives you the sentiment, low reading is bullish and high reading is bearish. This chart is fascinating! We can see that cash is flowing out of bear funds and money markets, but we aren't seeing an equivalent rise in the bull funds. This suggests there is money on the sidelines. It isn't a surprise. We are nearing the end of summer ("Sell in May, Go Away") but we have also been in a sideways trading channel on the SPX for some time. With overhead resistance holding tight and support holding up with no real discernible trend, it seems most investors would rather wait on the sidelines.
Note that the Rydex Cashflow Ratio is almost an even "1", which would be considered perfectly neutral. With money coming out of the bear funds, one would expect the amount of bull funds to increase and show a small ratio reading (when the denominator "bull funds" approaches infinity, the ratio gets smaller and smaller). Sentiment is not bearish, but it isn't bullish either.
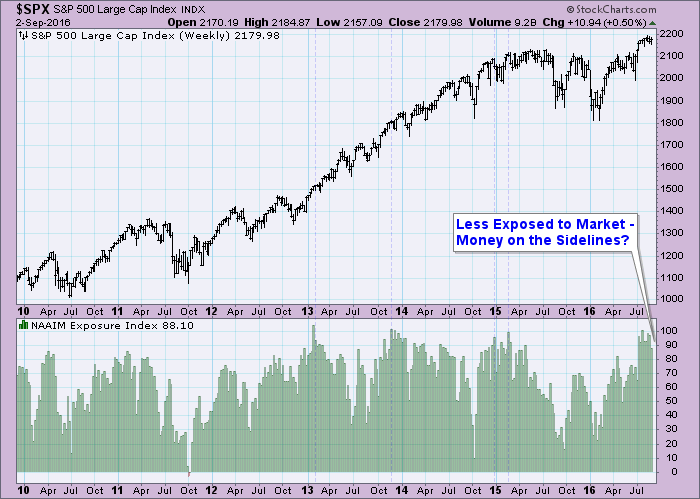
Notice that on the National Association of Active Investment Managers (NAAIM) sentiment chart, we can see that market exposure is being lessened which also could imply more money on the sidelines available for investment.
Conclusion: The DecisionPoint postures are moving from neutral to somewhat bullish, mainly because of charts like the ones above. The Short-Term Trend Model (STTM) Neutral signals that were generated on the SPX and OEX this last week were quickly overridden by new STTM BUY signals. I'm not advocating a new bull market rush just yet, but I am pointing out that there are bullish indicators out there and we shouldn't ignore their input.
The NEW DecisionPoint LIVE public ChartList has launched! Click on the link and you'll find webinar charts annotated just before the program. Additional "chart spotlights" will be included at the top of the list. Be sure and bookmark it!
Come check out the DecisionPoint Report with Erin Heim on Wednesdays and Fridays at 7:00p EST, a fast-paced 30-minute review of the current markets mid-week and week-end. The archives and registration links are on the Homepage under “Webinars”.
Technical Analysis is a windsock, not a crystal ball.
Happy Charting!
- Erin
