First, I'd like to invite everyone to join us via the internet for ChartCon 2016. It's only three weeks away and everyone here is growing very excited for this one-of-a-kind event. There will be tons of technically-oriented presentations from leading technical experts. You don't want to miss this! Be sure to register soon as ChartCon is rapidly approaching. There's an information page discussing the speakers, agenda, theme, etc. CHECK IT OUT HERE!!!
I'll be discussing repeating historical trends at ChartCon 2016, as well as participating on a panel discussion, so please join me for those. Along historical lines, September has been a very poor month for the S&P 500 over the past twenty years, as reflected below:
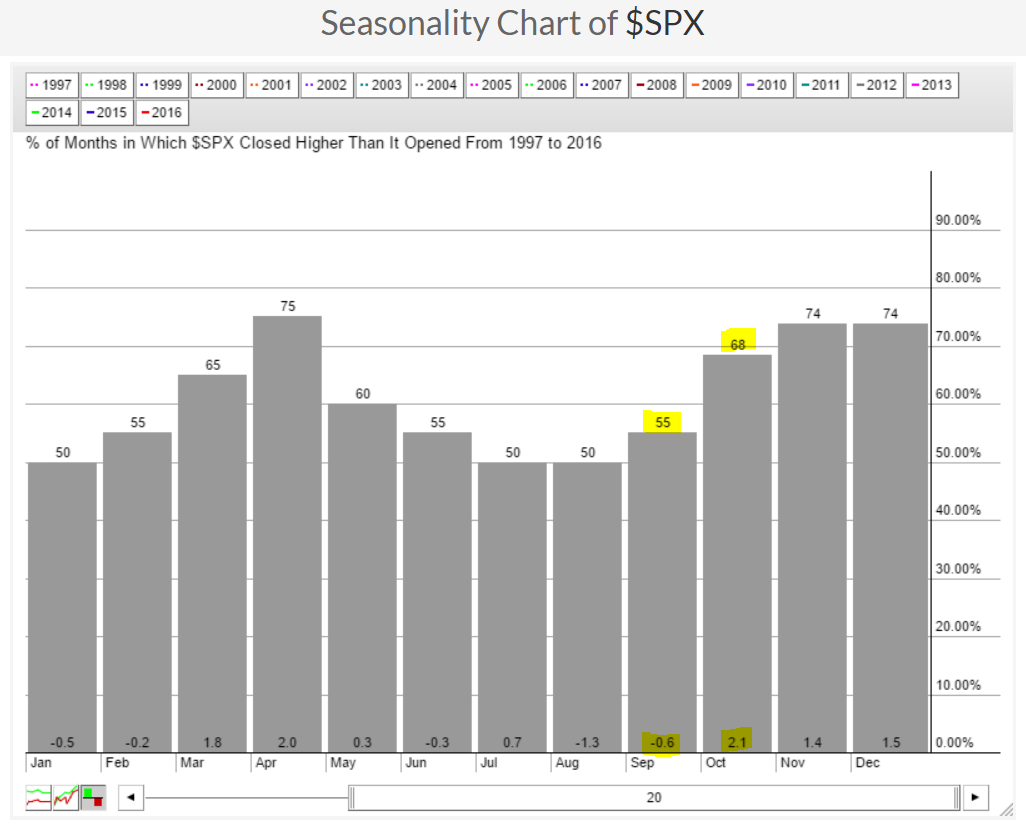 You can see that over the past twenty years, the S&P 500 has averaged a loss of 0.6% during the month of September. August is the only month that has produced worse results over the last two decades. While the above chart doesn't show it, September is the only calendar month since 1950 that has finished lower more than it's finished higher. And September has produced the worst calendar month results since 1950, bar none. Therefore, if U.S. equities are to rise this month, they'll have to do so vs. strong historical headwinds. Some have suggested that this historical pattern doesn't apply during presidential election years. I'll save my stats for ChartCon, but that is one piece of historical data that I'll address.
There's also the "Go away in May" crowd, which is the recognition that the November 1 to April 30 stock market performance is much stronger than the May 1 to October 31 performance. While this is true, you can see from the above chart that over the past twenty years, October has been the BEST calendar month in terms of average monthly gains. So this theory begs one very important question: Can you really afford to be out of stocks in October? I'll address the "Go away in May" theory and provide you my historical facts - when's the best time to be in and when's the worst time.
So given the historical weakness in September, should you simply sit this month out? I don't believe so. The historical facts are just that - historical facts. They don't provide us any guarantees. Furthermore, September doesn't experience losses every year, there's simply a stronger tendency to do so. Currently, we're in a bull market so "sitting out" is generally not a great idea. There have been pockets of industry strength during September over the past two decades and here's a sample of industry groups that have a very nice track record during this month:
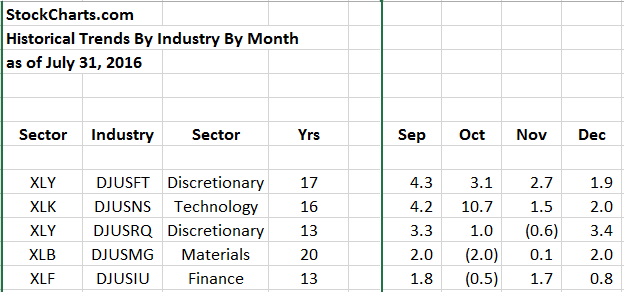 The footwear ($DJUSFT) and internet ($DJUSNS) groups really stand out to me as the best and second best industry groups during September. Obviously they've generated very solid average September returns over the past 17 and 16 years, respectively. Perhaps just as important, however, is that September strength is followed up by historical strength throughout the fourth quarter as well. For instance, the DJUSNS has averaged gaining 4.2% during the month of September, but has been scorching hot in October with average gains of 10.7%. The DJUSNS is one of the best looking areas of the market technically to boot. Check out this chart:
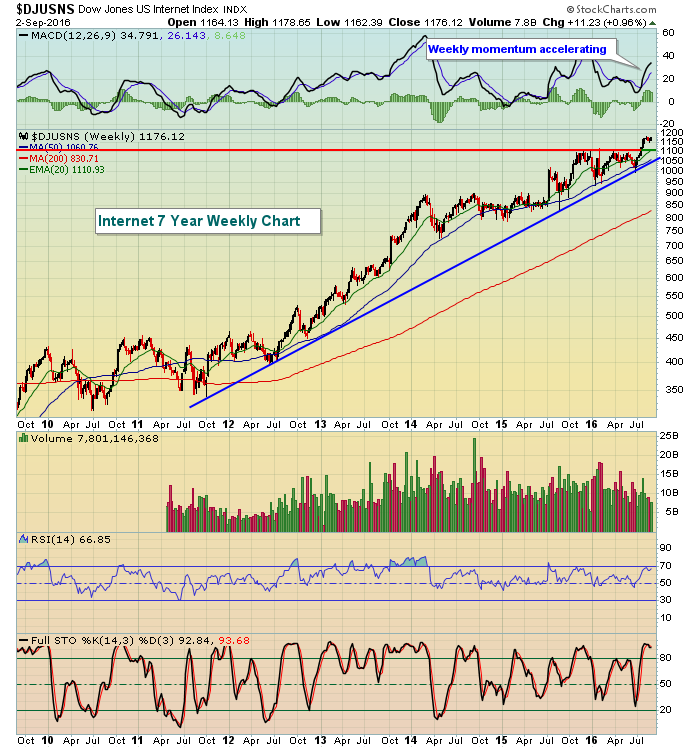 The seven year bull market has been very kind to internet stocks and other than being a tad overbought, there's not much here to argue with. I'd expect to see higher prices into year end. Significant price support resides near 1100 and trendline support is quickly approaching from underneath as well.
Happy trading and I hope you'll join us at ChartCon 2016!!!!
Tom


