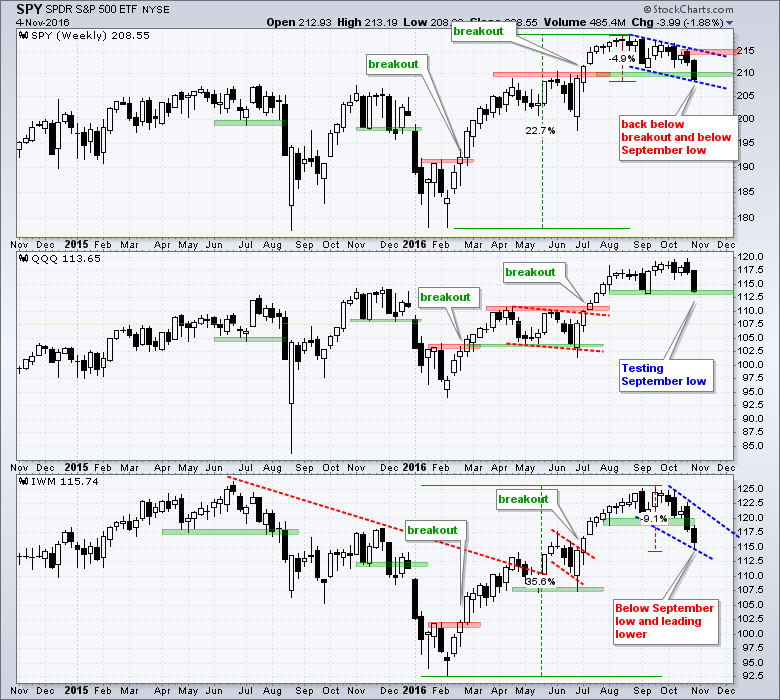
The S&P 500 SPDR (SPY) and the Russell 2000 iShares (IWM) both broke below their September lows with IWM leading the way lower. QQQ is still holding up the best because it hit a 52-week high the week before and remains above the September low. Looking at SPY first, the ETF fell around 5% from high to low over the last eleven weeks. This modest decline comes after a 22% advance from the February lows and a 10% advance from the late June low. Even though the inability to hold the breakout is negative, I still view this as a correction within a bigger uptrend. The blue trend lines mark a possible falling channel to define this correction and I am marking resistance at 215.50.
The bottom window shows IWM advancing around 35% from the February low and 17% from the June low. The ETF then fell around 9% over the last six weeks. IWM is down the most of the big three, but it was also up the most from its February low. The bigger they surge, the harder they correct. It is possible that a falling wedge is taking shape on the price chart. Chartists can watch the upper trend line for the first sign that this correction is ending. A weekly close above 122 would break this trend line.
****************************************
Thanks for tuning in and have a good weekend!
--Arthur Hill CMT
Plan your Trade and Trade your Plan
*****************************************


