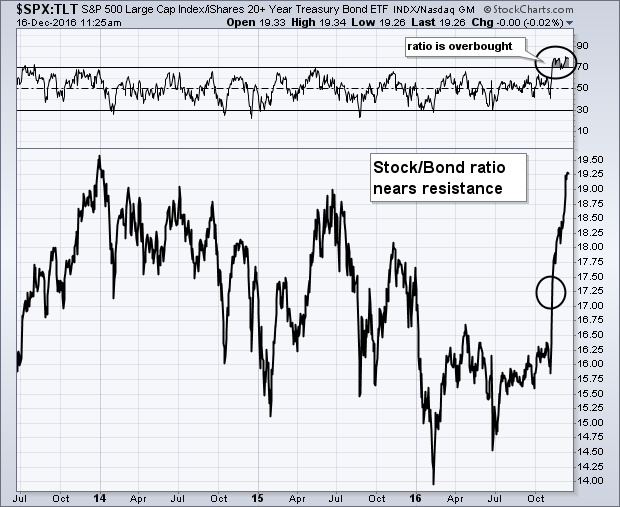
Several market messages over the past couple of months used relative strength ratios to paint a more bullish picture of the stock market, and a more bearish picture for bonds. While those ratios have strengthened considerably, especially since the election, I'm a little concerned that they're starting to look stretched. On October 28, I showed a ratio of the S&P 500 divided by the 20+year Treasury Bond ETF turning up in favor of bonds. That's the lower circle in Chart 1. Since then, the stock/bond ratio has soared to the highest level in nearly three years. That puts it up against a potential resistance barrier at its late 2013/early 2014 peak. In addition, its 14-day RSI (top of chart) has reached the 80 level which is the most overbought reading in years. More concerning is the fact that its 14-week RSI line has also reached overbought territory.
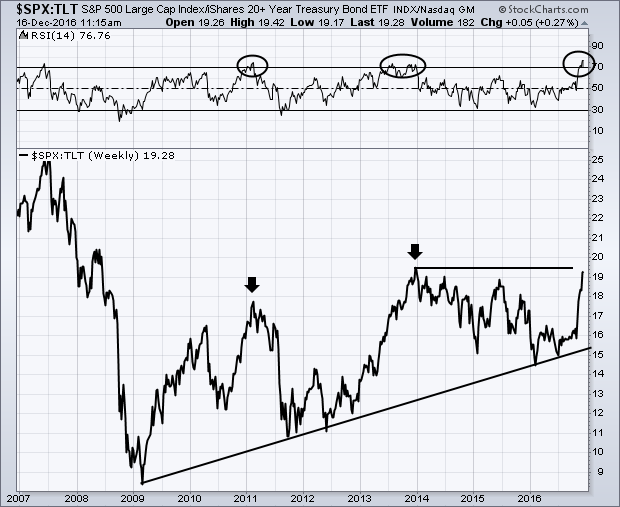
 For the study of major market trends, weekly indicators are usually more reliable than dailies. Chart 2 shows a "weekly" version of the same stock/bond ratio from Chart 1. The pattern of higher peaks and higher troughs since 2009 has generally favored stocks over bonds. That wasn't true, however, during 2011 when the stock/bond ratio dropped, or during 2014 and 2015. During those three years, bonds did better than stocks. The rising ratio during 2016 shows the pendulum swinging back to stocks, especially since the election. There are a number of points worth noting here. Over the longer run, the shape of the ratio appears to favor stocks over bonds. Over the shorter run, however, there is some concern. First, the ratio is nearing a previous peak from three years ago where it could meet some resistance. The second is the fact that the 14-week RSI line (top of chart) is in overbought territory over 70 for the first time since late 2013 (and early 2011). Both instances led to pullbacks in the ratio. All I'm suggesting here is that the stock/bond ratio appears very stretched. In other words, the steep move out of bonds into stocks may be getting overdone. That would suggest a bit more caution pushing the buy stock/sell bond strategy, especially as we enter the new year. We see the same pattern in several other ratios.