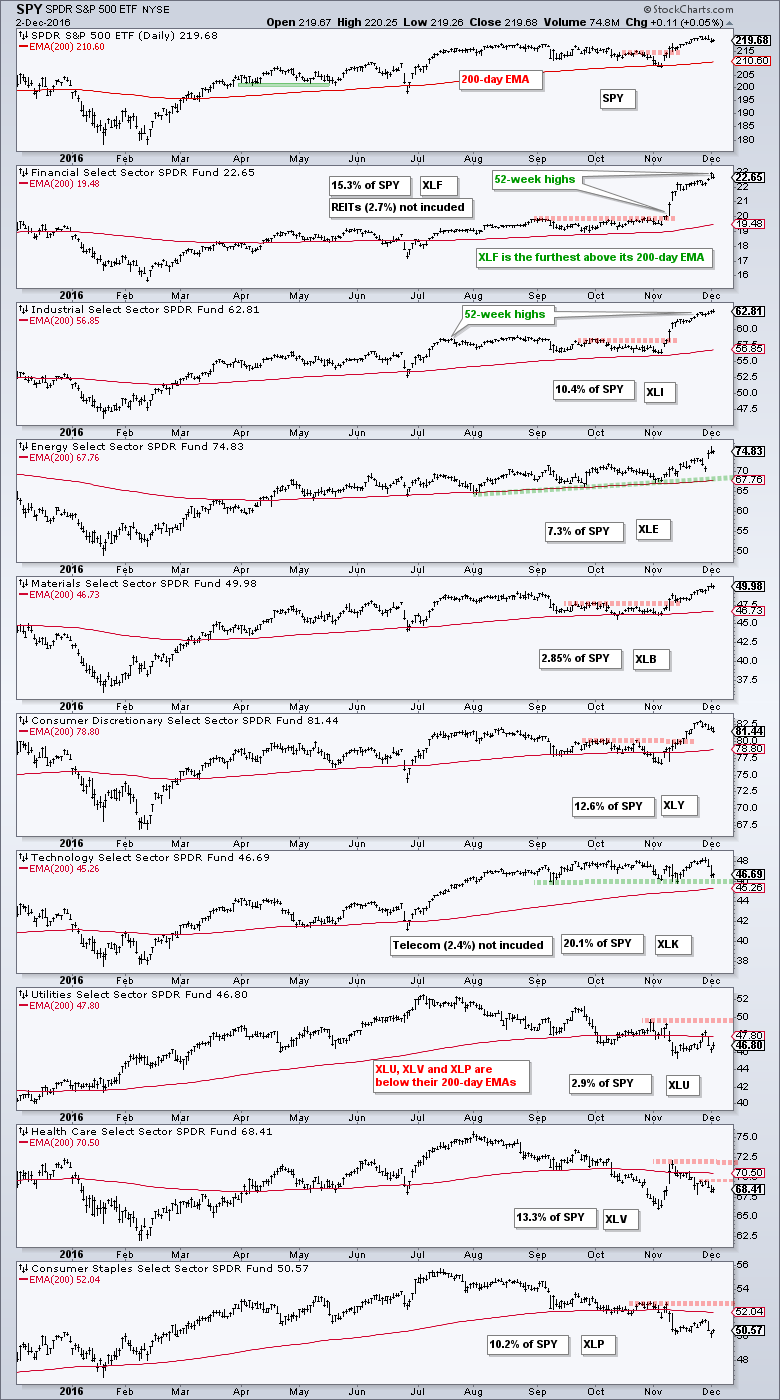
The whole is only as strong as the sum of its parts. Applying this logic to the stock market, the S&P 500 represents the whole and the nine sector SPDRs represent the sum of the parts. Let's see just how strong the parts of the S&P 500 are. The chart below shows SPY and the nine sector SPDRs. The sector charts are sorted by the percentage above the 200-day EMA with the highest at the top (XLF) and the lowest at the bottom (XLP). First, note that SPY is above its rising 200-day EMA and in a clear uptrend. Second, note that six of the nine sector SPDRs are above their 200-day EMAs and the 200-day EMAs are rising for all six.
The chart also shows the weightings for each sector and the six bullish sectors account for around 68% of the S&P 500. This is enough to keep the market in an uptrend overall. Of these six, the Technology SPDR (XLK) is the closest to its 200-day EMA and the one to watch. Three of the nine sector SPDRs are below their 200-day EMAs, but not by much. These three represent around 26% of the S&P 500 and they are weighing on the market. Note that REITs 2.7% and Telecom 2.4% were excluded from these calculations. REITs were part of the finance sector and most telecom stocks are part of the technology sector.
****************************************
Thanks for tuning in and have a good weekend!
--Arthur Hill CMT
Plan your Trade and Trade your Plan
*****************************************


