
Just like potato salad in the fridge, support and resistance levels for the S&P 500 have a shelf life and become stale over time. The value of the S&P 500 is based on the price of its individual component stocks. Support and resistance levels for the index loose their importance over time because component stocks and weightings change on a regular basis. The further the look back period, the bigger the transformation in this key index. The S&P 500 in 2017 is not the same as the S&P 500 in 2010, and certainly not the same as the S&P 500 in 1999. Chartists should keep this in mind when considering support and resistance levels for the S&P 500, as well as for other indexes and ETFs based on a basket of stocks.
David Blitzer, Chairman of the Index Committee for S&P Dow Jones Indices, notes that 25-30 stocks are changed every year in the S&P 500. Siblis Research notes that the index averaged 22 component changes per year over the last fifty years. Most recently, there were 26 component changes to the S&P 500 in 2016, 24 in 2015 and 15 in 2014. Overall, this means a couple dozen stocks are replaced every year and these changes add up over time. At this rate, we can assume that less than half of the stocks currently in the S&P 500 were part of the index in 2000.
In addition to component changes, the weightings for these components fluctuate on a regular basis. A stock's market capitalization increases as its price rises and this increases its weight in the index. Conversely, market cap decreases as a stock's price declines and this decreases its weighting. The table below shows the top ten S&P 500 stocks in 1999, 2007 and 2017 (ETF Database).
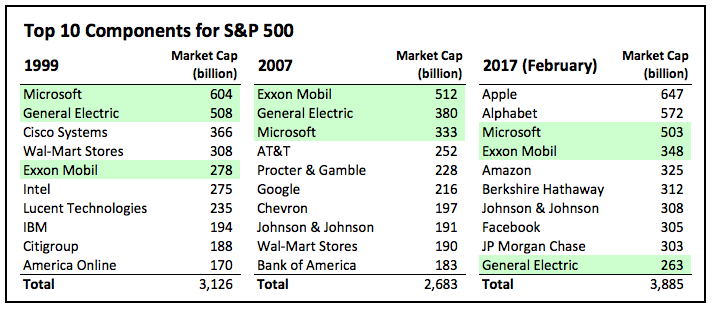 Only three stocks remained in the top ten over the last 18 years. Four of the top ten stocks in 2007 are not part of the top ten in 2017. Also notice that the market cap for General Electric fell significantly from 2007 to 2017, while the market caps for Microsoft and Alphabet increased substantially. Apple, the top stock in February 2017, was not even in the top ten in 2007. The S&P 500 went through quite a transformation over the last ten years.
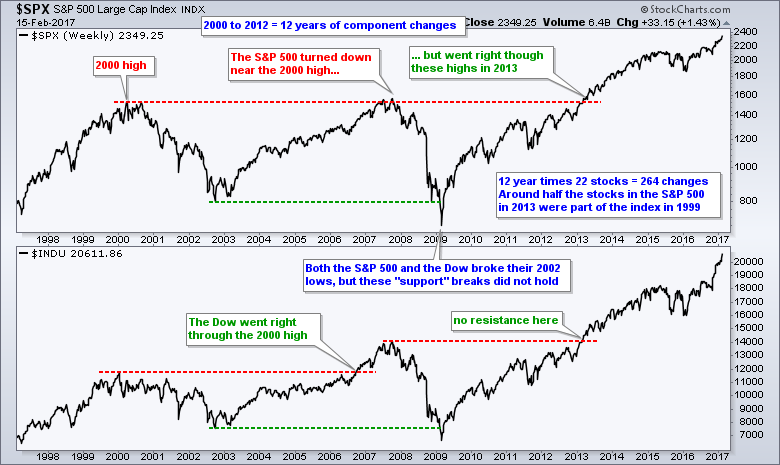
The chart below shows the S&P 500 and the Dow Industrials with red lines marking the 2000 and 2007 highs, which are the so-called resistance levels. Even though the S&P 500 turned down near the 2000 high in 2007, I think this is more coincidence than a robust resistance level. First, the S&P 500 was not the same index because its components and weightings changed significantly from 2000 to 2007. Second, the Dow did not hit resistance at this high. Also note that the S&P Small-Cap 600 and S&P MidCap 400 did not hit resistance from their 2000 highs. Third, the S&P 500 blew through a so-called major resistance level in 2013.
 I am not suggesting that chartists throw out the concepts of support and resistance. However, we need to think twice when analyzing an index, average or ETF that undergoes component changes and weighting adjustments over time. The older a support or resistance level, the less robust it really is. This also means that chartists should focus more on the present and less on the past.
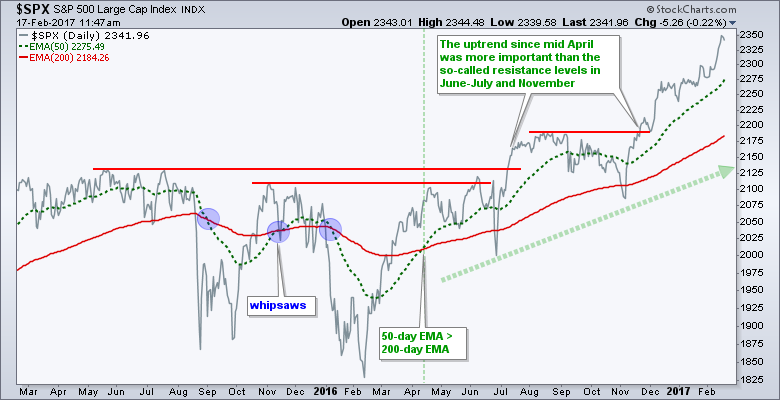
The chart below shows the S&P 500 with the 50-day EMA crossing above the 200-day EMA in mid April 2016. Even though there were whipsaws prior to this cross, past resistance levels were ineffective in June-July and November because the current uptrend carried more weight. A current uptrend is more powerful than a past resistance level.
****************************************
Thanks for tuning in and have a great day!
--Arthur Hill CMT
Plan your Trade and Trade your Plan
*****************************************


