I am asked constantly about how to use the Price Momentum Oscillator (PMO) and Trend Models in a scan. These two ingredients combine into a great tandem for the scan engine. I'll give you a reprint of the scan and analyze a chart I found in it today.
First, here is the scan with explanations commented in for you:
// Determine the universe you want to scan:
[type = stock] AND [Daily SMA(20,Daily Volume) > 50000]
and [country = US]
// PMO has been rising for three days:
AND[today's PMO Line(35,20,10)<today's PMO Signal(35,20,10)]
AND [today's PMO Line(35,20,10) > yesterday's PMO Line(35,20,10)]
AND [yesterday's PMO Line(35,20,10) > 2 days ago PMO Line(35,20,10)]
AND [2 days ago PMO Line(35,20,10) > 3 days ago PMO Line(35,20,10)]
// Trend Model Configuration (LTTM BUY Signal 50-EMA > 200-EMA as well as NEW STTM BUY 5-EMA > 20-EMA):
AND [today's ema(50,close) > today's ema(200,close)]
AND [today's ema(5,close) > today's ema(20,close)]
AND [yesterday's ema(5,close) < yesterday's ema(20,close)]
I ran this scan during the webinar and there were 60 hits. I recommend you watch the webinar or read an article I wrote awhile back on using CandleGlance to review your results. You can quickly see chart patterns and where the PMO bottoms are appearing (above/below signal line, etc.). I scrutinized today's list of 60 and found KapStone Paper (KS) for a Chart Spotlight today:
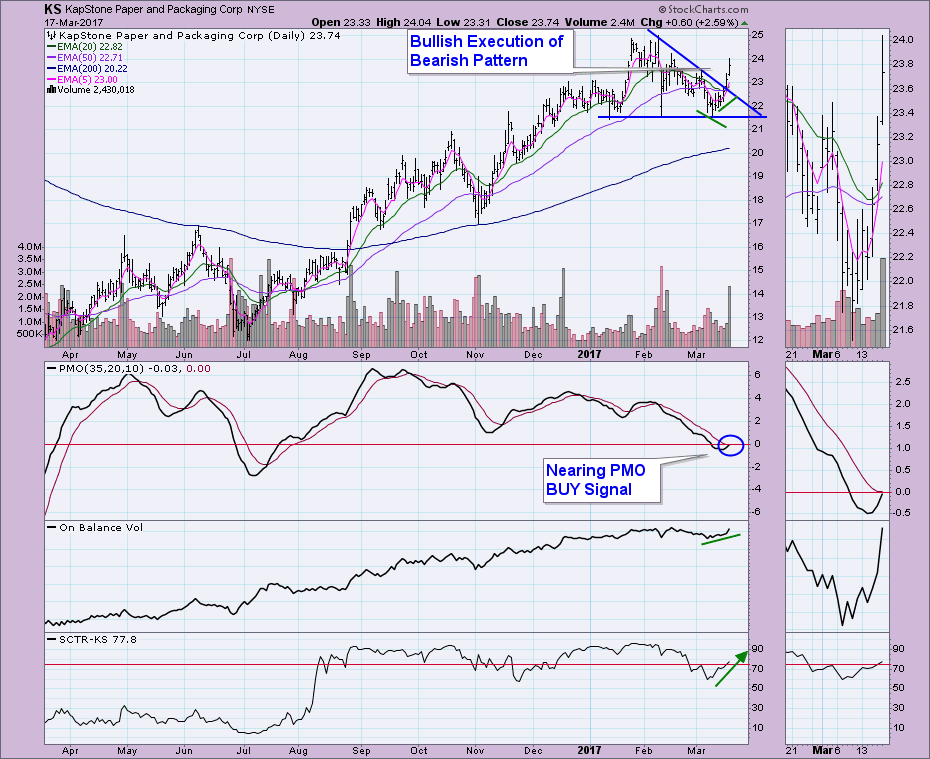
There are both an early bullish divergence and subsequent bullish confirmation by the OBV. This rally breakout was a bullish execution of a bearish pattern, which I find especially bullish. As the scan was supposed to do, we see a new ST Trend Model BUY signal as the 5-EMA just crossed above the 20-EMA and an approaching PMO BUY signal. The SCTR is heating up as well.
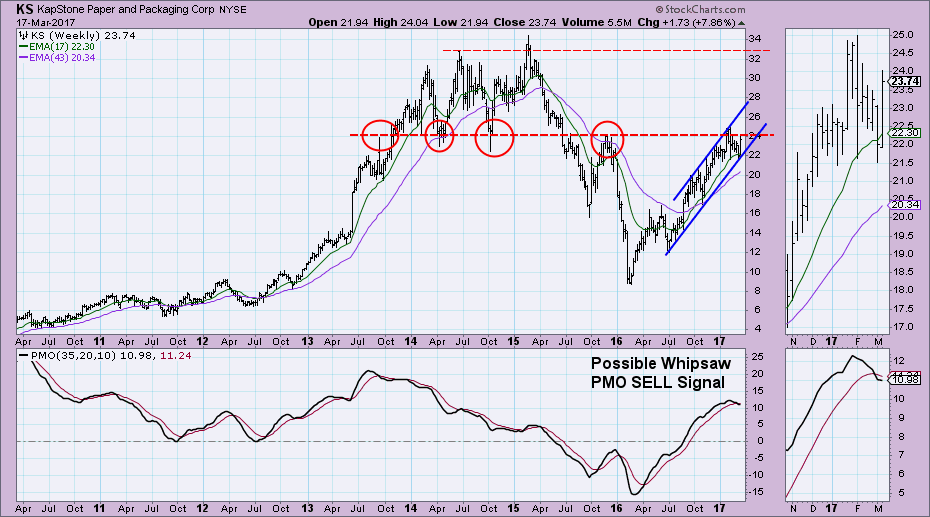
I like the weekly chart, but I am waiting for a few things to occur before I'd make this a longer-term buy. The rising trend channel looks great, but price has been stopped at resistance around $24.50. This is a very strong area of resistance as it lines up with multiple price bottoms and tops. We see that earlier this year price was unable to push past that resistance. The IT PMO is currently on a SELL signal but it is reversing. This could turn out to be more of a whipsaw SELL signal. I'd watch for that breakout and reevaluate timeframes.
The NEW DecisionPoint LIVE public ChartList has launched! Click on the link and you'll find webinar charts annotated just before the program. Additional "chart spotlights" will be included at the top of the list. Be sure and bookmark it!
Come check out the DecisionPoint Report with Erin Heim on Wednesdays and Fridays at 7:00p EST, a fast-paced 30-minute review of the current markets mid-week and week-end. The archives and registration links are on the Homepage under “Webinars”.
Technical Analysis is a windsock, not a crystal ball.
Happy Charting!
- Erin


