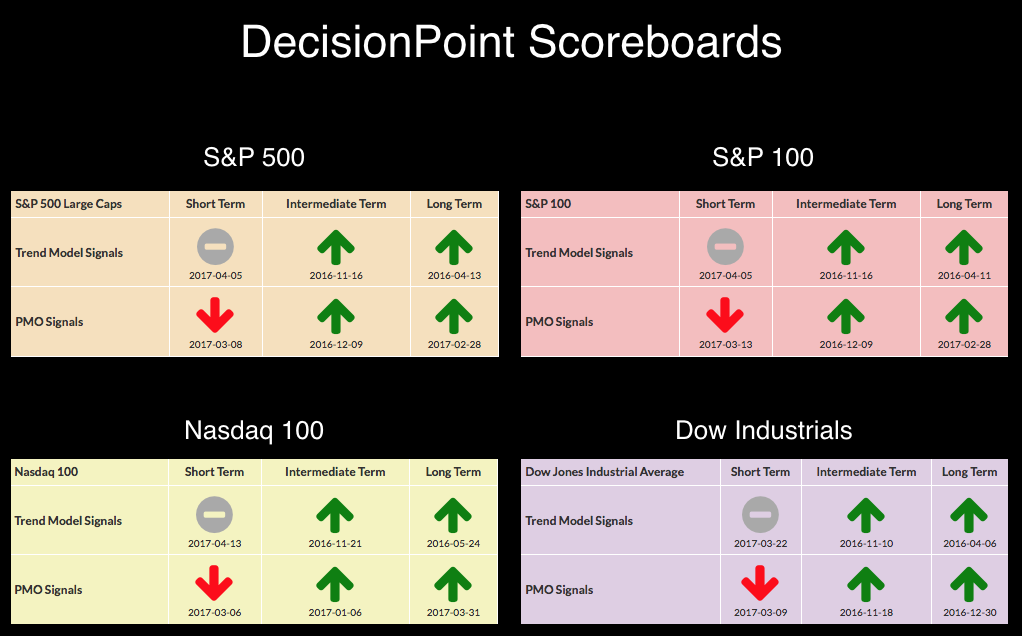
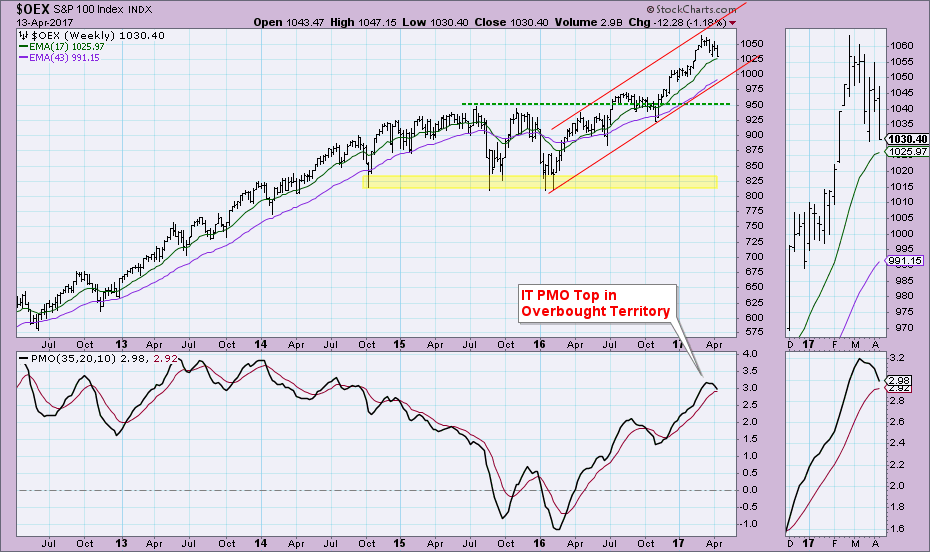
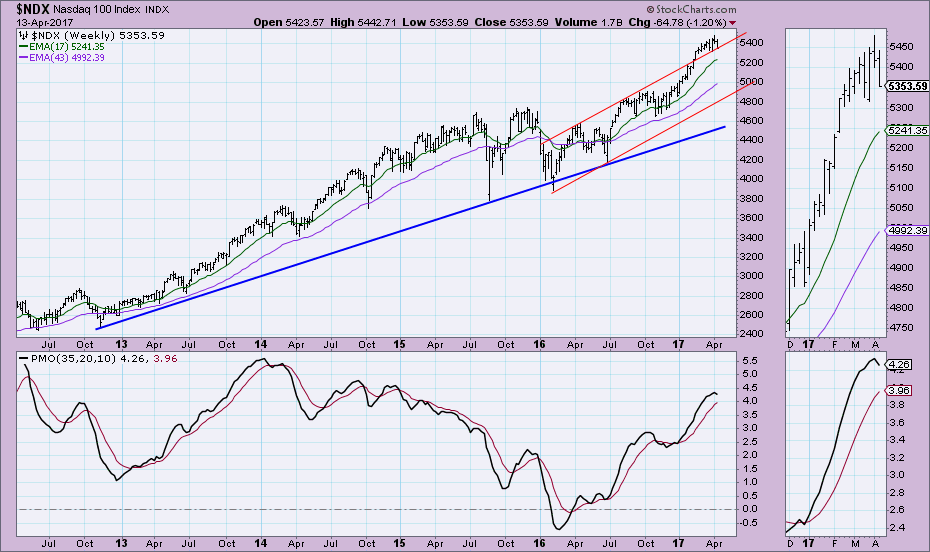
 One look at the DP Scoreboards and it is apparent there are problems in the short term. It appears that the intermediate term is sitting comfortably on BUY signals. That is true for the IT Trend Models (20/50-EMA crossover signals on daily chart), but momentum had already starting waining on the weekly charts for these indexes and now all of them are vulnerable to IT Price Momentum Oscillator (PMO) SELL signals this Friday.
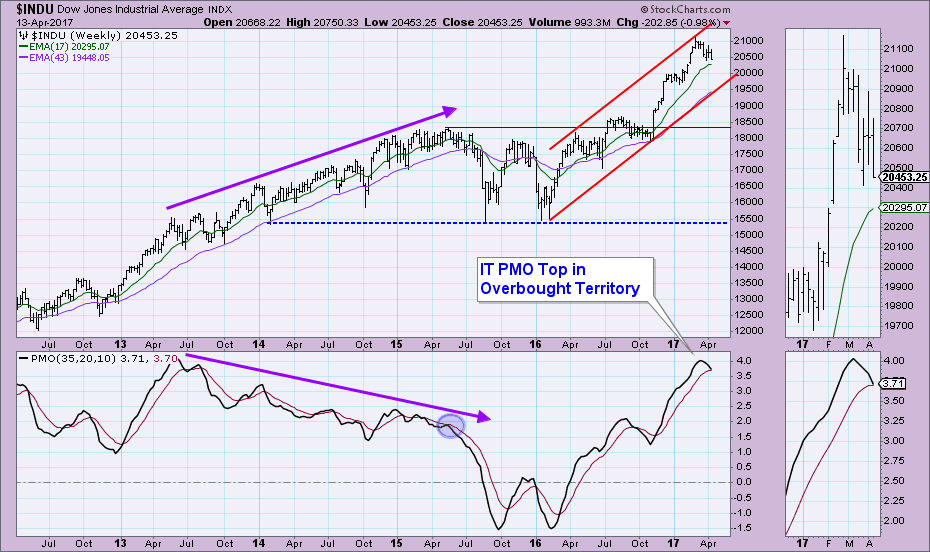
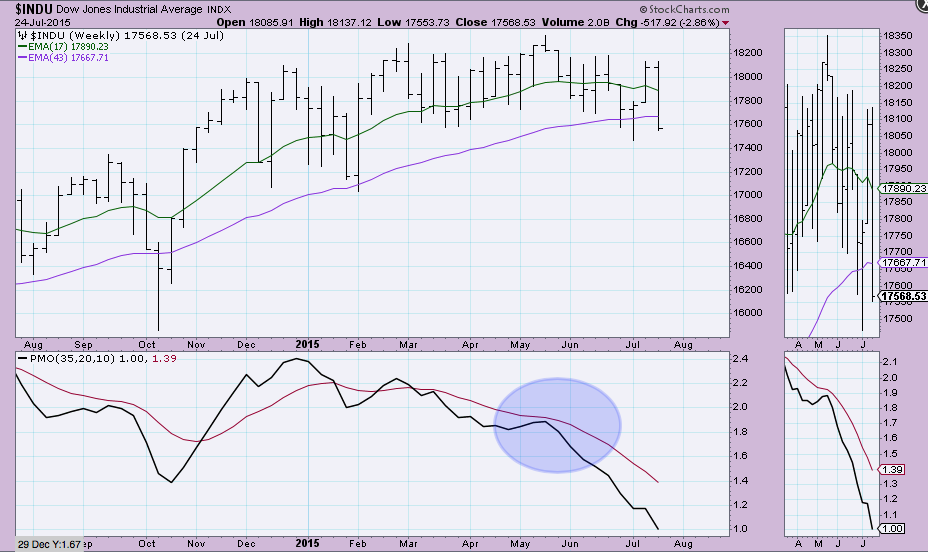
The Dow barely escaped a PMO SELL signal this week as the IT PMO closed only .01 above its signal line. The large amount of territory yawning within the rising trend channel is of most concern. While a cyclical bull market is in effect, price could test the bottom of this channel and still maintain the appearance of a bull market. Before everyone starts running for the hills, I would ask you to note the PMO SELL signals that arrived in overbought territory back in 2013. We saw an extremely overbought negative crossover SELL signal twice and despite triggering and watching the PMO drift lower, trouble didn't actually arrive until 2015. The negative divergence was obvious between the PMO and price tops from 2013 to 2015, so the decline was set up. How were we to know when it was time for the market to actually correct? There was a "bear kiss" of the signal line by the PMO (Read more about bear and bull "kisses" in this PMO article). It is like a bull trap or head fake, sucking in bulls right before the fall. I suspect we will see some decline off this imminent weekly PMO SELL signal, but given the bullish confirmation of PMO and price tops during this cyclical bull market, I suspect that support will hold at the bottom of the rising trend channel which should be around 20,000 by the time price reaches it.
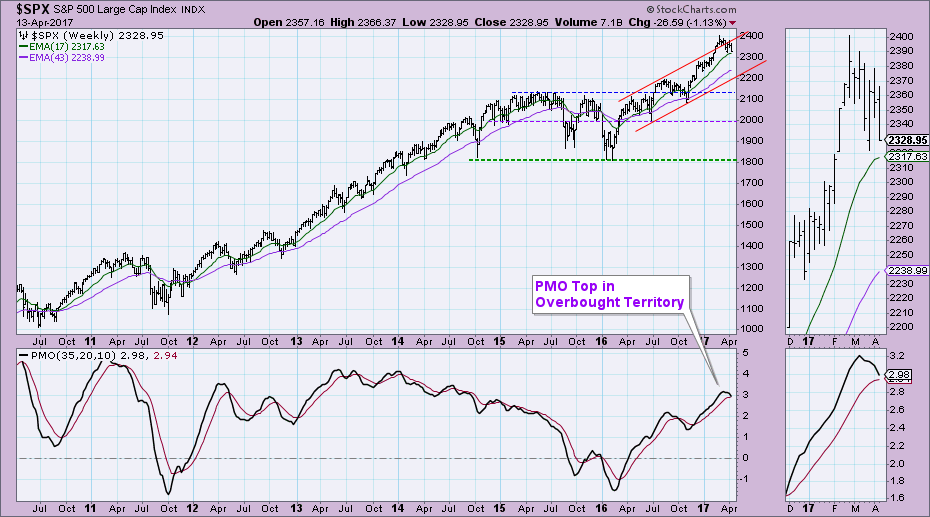
 As far as the other indexes, similar weekly PMO SELL signals are lining up. The SPX and OEX are facing the same type of support as the Dow, the bottom of the rising trend channel. All indexes are getting bullish confirmation from the PMO tops compared to price tops, so I am not looking for a crash. More likely we will see a successful test of the bottom of the rising trend channels with more rising prices. Note what happened on the last PMO SELL signals. We got warning of the impending pullbacks which preserved some profit.
The NDX is already at support along the top of its rising trend channel. I suspect it won't hold out up there and will make a move back inside the channel. If it follows suit with the other Scoreboard indexes, we should expect a breakdown back into the channel. I'll reserve judgment regarding the depth of destruction or lack thereof once price drops back inside the channel and tests the 17-week EMA.
The DecisionPoint LIVE Shared ChartList is available now! Click on the link and you'll find all your favorite DP charts all annotated! Be sure and bookmark it!
Technical Analysis is a windsock, not a crystal ball.
Happy Charting!
- Erin
