
The bar was 61.8 inches off the floor, but Leondardo still did not see it. All (bad) joking aside, I would like to look at corrections through the eyes of Charles Dow and Leonardo Fibonacci. These two may seem miles apart at first glance, but the numbers suggest otherwise. In fact, Dow and Fibonacci are pretty much on the same page when it comes to retracement amounts. Charles orders a frosty mug of beer, Leonardo orders a glass of Tuscan red wine and they start talking technical analysis.
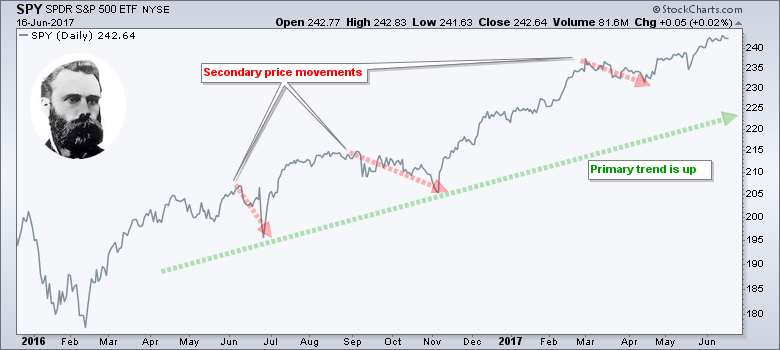
Charles starts out by describing the trend according to his theory. A primary movement is a broad trend that lasts for an extended period of time. This can be a long-term uptrend, a long-term downtrend, a bull market or a bear market. There are secondary reactions within this primary movement and these move counter to the primary trend. For example, an advance within a primary uptrend is considered part of the primary trend. A decline within a primary uptrend is considered a secondary reaction. Dow goes on to suggest that secondary reactions “generally retrace 33 to 66 percent” of the prior primary movement (Robert Rhea, The Dow Theory). Here is a chart of SPY showing the primary and secondary price movements.
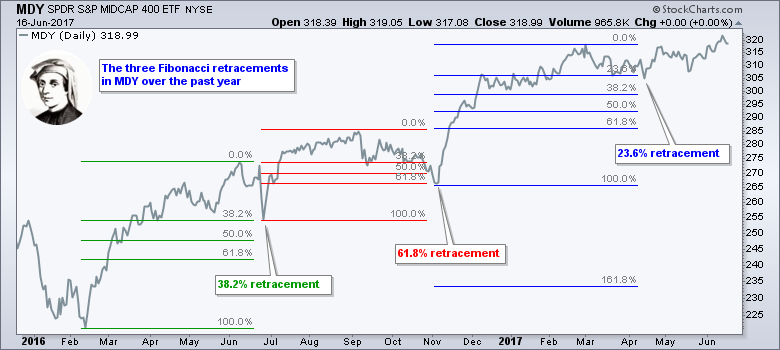
 Leonardo takes a sip of wine, ponders and then offers his take on retracements. Charles, there is a numerical sequence based on the breeding of two rabbits. Without going into the breeding details, the number of rabbit pairs expands each month as follows: 1, 1, 2, 3, 5, 8, 13, 21, 34, 55, 89, 144 …). The ratios of these numbers are found throughout nature and can be used to measure retracements in the stock market, which are based on human behavior (aka human nature). The ratio of one number to the next highest approaches .618 (34/55 = .61818 or 61.8%) as the sequence extends. Furthermore, the ratio of one number to the number two places higher approaches .382 (34/89 = .38202 or 38.2%) and the ratio of one number to the number three places higher approaches .236 (34/144 = .23611 or 23.6%). Thus, we should be watching the 23.6%, 38.2% and 61.8% retracements when it comes to these secondary price movements. Just to prove it, here is a chart of MDY with all three of my retracements at work.
 Arturo Hill just happened to be tending the bar that night and had to chime in on the debate. Gentlemen, your numbers are not too far off. One-third is fairly close to 38.2% and two-thirds is close to 61.8%. We cannot be too exact because the markets are driven by fear and greed, which means they are prone to overshoots and undershoots. In principle, an extended advance should work its way higher with two steps forward and one step backward (correction). As Charles noted in his theory, neither the length nor the duration of a trend can be forecast. I think this is also true of secondary price movements and retracements. We never know how far a correction will extend. Judging from your retracement theories, it seems that a correction should retrace a minimum of 23.6% (Fibonacci) and a maximum of 66.7% (Dow).
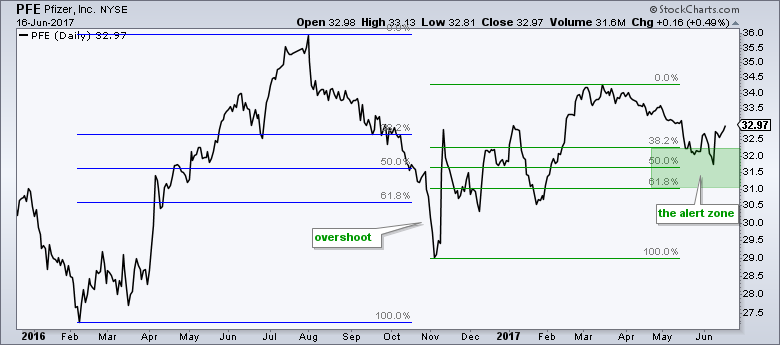
Truth be told, chartists can look at ten different corrections and find ten different retracement amounts. These can range from 22.2% to 71.5%, which are hypothetical numbers because we simply don’t know how far a correction will extend. Even though it does happen, we should not expect a stock to end its correction and reverse at an exact Fibonacci or Dow retracement. Instead, I go on reversal alert when a stock enters a retracement zone, say 38-62%. It is time to watch closely and look for some sort of bullish catalyst when a correction enters this zone. The chart below shows Pfizer overshooting on the prior correction and bouncing off the middle of the alert zone over the last two weeks. Looks like a bullish catalyst to me!
Follow me on Twitter @arthurhill - Keep up with my 140 character commentaries.
****************************************
Thanks for tuning in and have a good day!
--Arthur Hill CMT
Plan your Trade and Trade your Plan
*****************************************


