History tells us many things. One of the lessons is that making money on the long side is much more difficult during the summer months. Why? It's rather simple. On the S&P 500 since 1950, here are the annualized returns by calendar months over the summer:
June: -0.02%
July: +12.21%
August: -1.07%
September: -6.01%
Including the current month, three of the four summer months above have produced negative annualized returns over the past 68 years. This tells me that you need to narrow your focus, exercise patience and remain disciplined with stops. Also, expectations are key. If you're trading on the long side, it makes sense to me that you shouldn't expect the same kind of returns during the summer months that you enjoy during other, more bullish months of the year. Lower expectations will translate into fewer and higher quality trades. Don't force trades.
I nearly always trade companies that combine both strong fundamentals (better than expected revenues and earnings) and healthy charts. I review quarterly results from companies as they report each day. Those companies that beat both top and bottom line estimates are then reviewed technically. I love to see powerful responses and high volume gaps after earnings reports and I save them in a ChartList here at StockCharts. That becomes my "go to" list for potential trades. I then further narrow my focus to those high quality companies that are returned on my favorite scans. If you review many company charts in uptrends, you'll discover that RSI 40-50 is typically a powerful support level. Here are a couple examples:
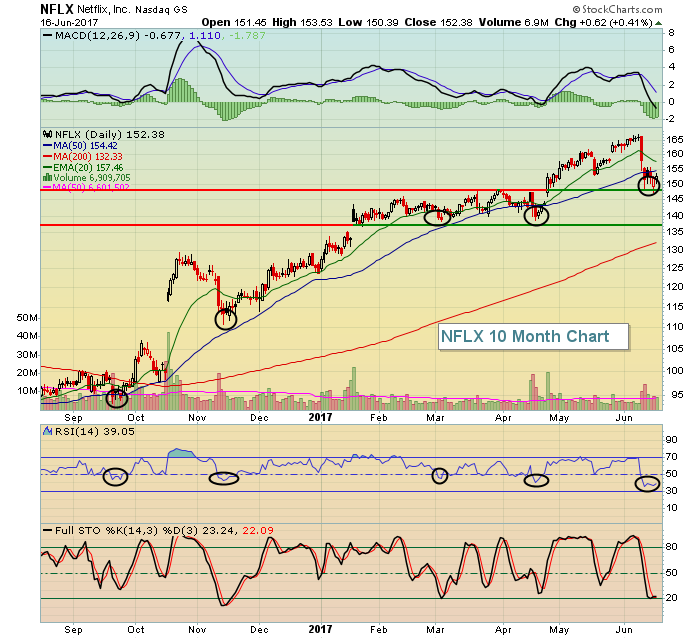 Netflix (NFLX) has been in a steady uptrend for months, but note that patience is key for entry points. Five times in the last 10 months NFLX saw its RSI drop back into that 40-50 range and it's been an excellent reward to risk trade every time. Currently, NFLX has an RSI reading of 39. While I'd prefer that the RSI 40 support level not be violated, it did so with price and gap support holding. So NFLX, in my opinion, currently rates as a very strong reward to risk buy. Here's another example:
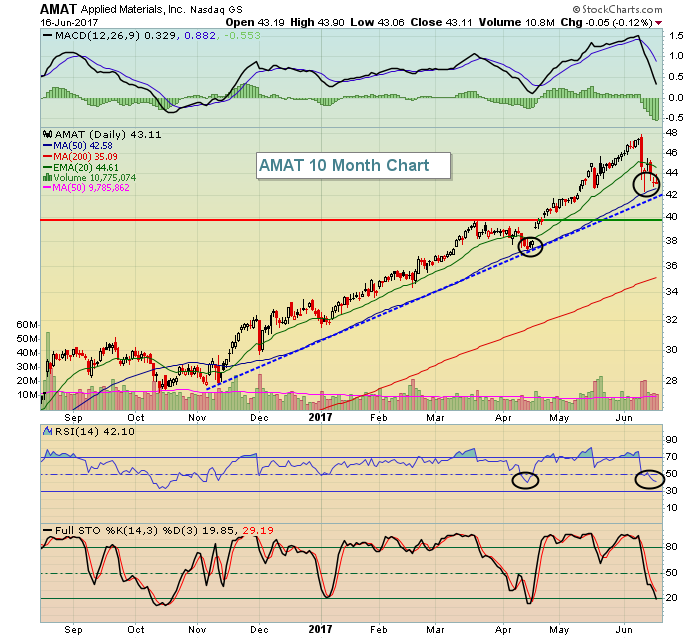 While Applied Materials (AMAT) has been a high flier this year, it did provide a solid entry point in April when its RSI dipped down to 40 as it was testing its rising 50 day SMA. The combination of an RSI in that 40-50 zone, along with other technical buy signals like 20 and 50 day tests, price support, trendline support, etc., can provide great short-term trading opportunities.
I'll be joining John Hopkins, President of EarningsBeats.com, for a webinar on Monday, June 19th. You can CLICK HERE to register for the event. It will start at 4:30pm EST and we'll be discussing much of what I wrote about above. I'll show you where I get my fundamental earnings information from, the process of setting up a dedicated ChartList on StockCharts.com and subsequently scanning methods that I use to narrow my search for high reward to risk trading candidates. Please join us!
Happy trading!
Tom


