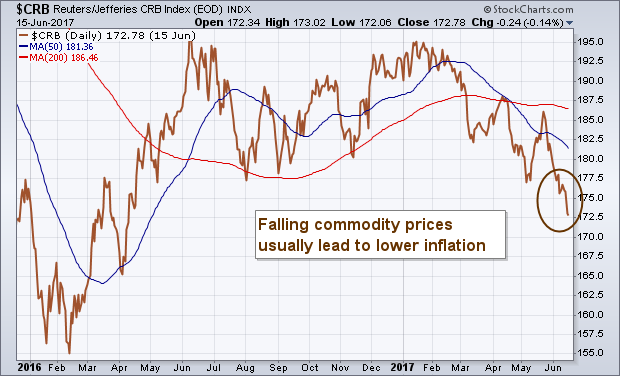
Ever since Wednesday's Fed rate hike, and the press conference by Janet Yellen, I've been thinking a lot about inflation. I believe the Fed is underestimating how weak inflation really is. I also believe that's because it's looking in the wrong places. Or, more to the point, it's ignoring the weak signals hiding in plain sight. Namely, falling commodity prices. Chart 1 shows the Reuters/Jefferies CRB Index falling this week to the lowest level since the spring of 2016. Ms. Yellen may refer to that falling trend as "noise". To a chart reader, it's called a downtrend. The CRB Index includes 19 actively traded commodities which include energy, industrial and precious metals, and agricultural markets. [The Bloomberg Commodity Index has also fallen to the lowest level in a year]. Ms. Yellen said that the Fed views the recent decline in inflation as transitory. She referred to a temporary drop in the cost of cellphone plans as an example of why inflation could bounce. Is that really what the Fed is relying on? What about falling food and energy prices. Then again, economists don't include those in their calculations for "core" inflation. [They consider them too volatile, whatever that means]. But that omission helps explain why they've been so wrong for so long on inflation. The implications are important. If the Fed is wrong on inflation, then it's plan to keep raising rates is misguided. Falling bond yields, and a flattening yield curve, suggest that bond traders are already suggesting that.
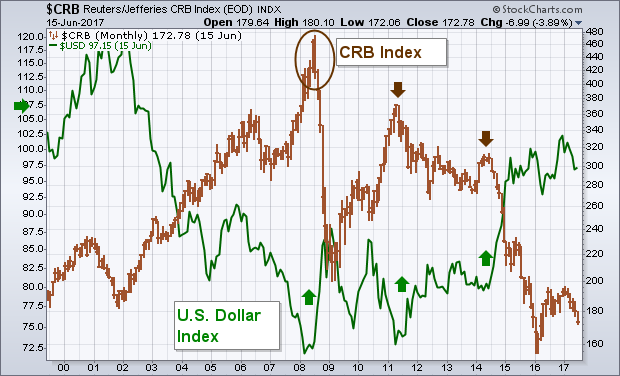
 After falling for two decades between 1980 and 2000, commodity prices rose between 2002 and 2008. That rise was mainly the result of a plunging U.S. Dollar. Chart 2 shows a dollar 2008 bottom, however, coinciding with a major commodity peak. A second dollar rebound in 2011 produced another CRB downleg. A third dollar upturn in 2014 produced an even steeper commodity downturn (see arrows). At the start of 2016, the CRB fell to the lowest level since the 1970s which raised fears of a dangerous deflation. They rebounded during 2016, but are falling again. Here's why that matters. The inflation pipeline has three stages. The first stage is the price of raw materials. The second stage is the price companies pay for raw materials (producer price inflation). The third stage is what companies charge consumers for their products (CPI inflation). It all starts with the direction of commodity prices. Strangely, that's the part that economists (and the Fed) pay no attention to. How can economists expect to predict the final stage of CPI inflation, if they ignore the first stage which is the direction of commodity prices?