As a stock market historian, if there's one thing that really annoys me, it's the talking heads saying to "go away in May". While the May through October period is clearly less bullish than its November through April counterpart, there are loads of reasons to be long U.S. equities during May, June, July and October. Seasonal strength to open and close calendar months is one such reason. The following are bullish historical periods on the S&P 500 during the May to October time frame with their respective annualized returns since 1950:
May 1-5: +35.11%
May 26 - June 6: +28.69%
June 28 - July 17: +24.02%
July 25 - August 2: +18.57%
August 31 - September 3: +32.24%
October 1-6: +37.93%
October 28-31: +72.72%
Those are seven different periods after the "go away in May" sabbatical begins that, quite frankly, I wouldn't want to miss as a trader. So while the overall returns during the May to October time frame pales in comparison to the November to April time frame, I'd still argue to remain active in trading throughout the period. The following represents the average returns for each six month period:
May through October: +1.37% (finished higher 42 times out of 67 years)
November through April: +7.05% (finished higher 52 times out of 67 years)
I believe the true "go away" period is from the July 17 close to the September 27 close. This period has been difficult and it begins at Monday's close. Over the past 67 years on the S&P 500, this much shorter two month and ten day period has risen 37 times. The average return during this 71 day period is -0.42%. The annualized return has been -2.18%. While that might not seem like much, it's actually more than 11 percentage points beneath the average annual return of approximately 9% that the S&P 500 has enjoyed since 1950.
Here is potentially the biggest problem. When we've seen big moves on the S&P 500 from July 17th to September 27th in the past, they've generally been downside moves. The S&P 500 has moved +/- 10% or more 11 times during this period since 1950 and 8 of those moves have been declines. Here are the eight awful summers:
1957: -12.41%
1966: -10.31%
1974: -22.31%
1981: -13.86%
1990: -18.11%
1998: -11.97%
2001: -16.13%
2011: -10.69%
So clearly this is the time of summer - and the year - when the stock market has the tendency to underperform. And from the above, you can see that the underperformance can be quite severe certain years. While I believe the long-term viability of the current bull market is sound, we did break out to an S&P 500 all-time high close on Friday with a negative divergence present on the weekly chart - a sign of slowing upside momentum:
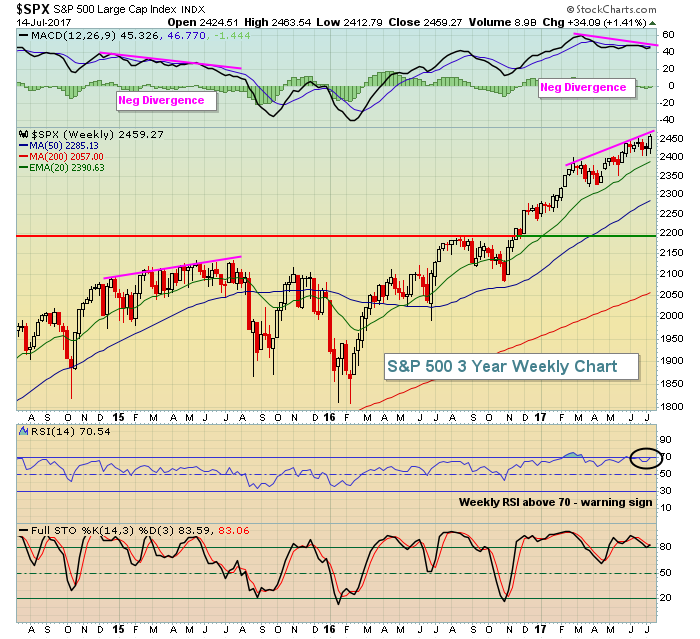 The last time we saw momentum slowing like this on the weekly chart was in 2015. Shortly thereafter, the S&P 500 dropped from 2135 to 1870 in two months! Perhaps it's a coincidence, but note that the highs were established in July 2015 and the ensuing weakness occurred in August and September - two notoriously bearish summer months that we're now approaching.
Will we see a repeat? Stay tuned.....
Happy trading!
Tom


