 On Fridays during the MarketWatchers LIVE show (12:00p - 1:30p EST), I do a regular segment that checks what weekly sentiment charts are telling us. Three of the best sentiment charts from DecisionPoint are the American Association of Individual Investors (AAII) sentiment poll, the National Association of Active Investment Managers (NAAIM) and the Rydex Asset Ratio. Despite jumping to a new all-time high on Friday, sentiment shows that the bullish exuberance may be fading somewhat. Typically we read sentiment charts as "contrarian". This means that when these charts so an exceptional amount of bulls, that is actually read as bearish for the market and vice versa. However, before the storm, we will usually see some clues that investors and money managers are getting a little antsy or concerned. That's where I think we are right now.
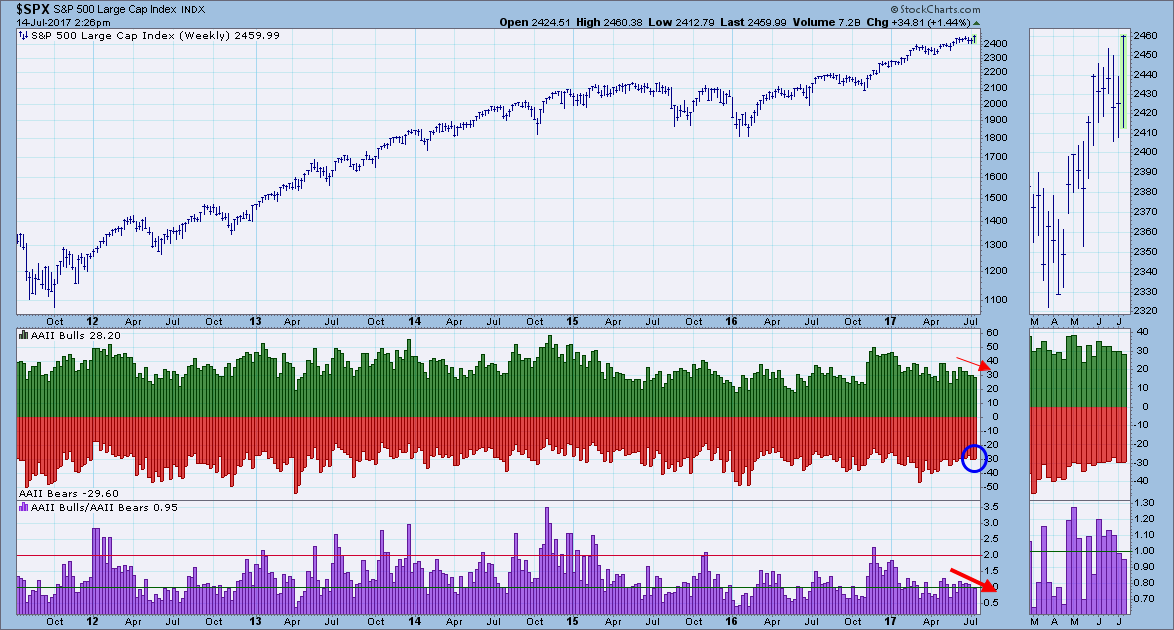
The AAII bull/bear ratio is nearly 1.0 which means there is nearly the same amount of bulls as there are bears. This was the case last week as well. However, looking at the numbers more closely, we see that there has been a slight increase in the number of bears and the number of bulls is clearly decreasing. I don't think it should be overlooked that 42% of respondents were neutral. I'm seeing more and more investors moving neutral which in my mind indicates complete uncertainty.
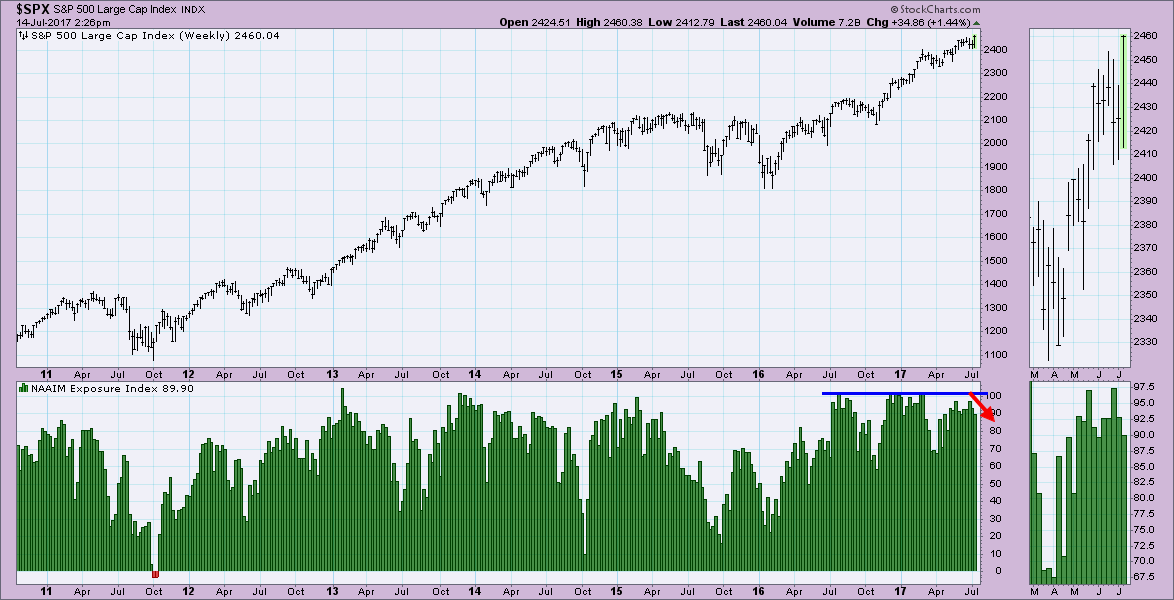
I've been noting every week on the MarketWatchers LIVE show that money managers have been less exposed during this recent rally from April bottom in comparison to their exposure along the previous two highs. That would indicate a slight increase uncertainty by the 'big guys' on this latest top. More concerning is the steady decrease over the past two weeks in the exposure reading.
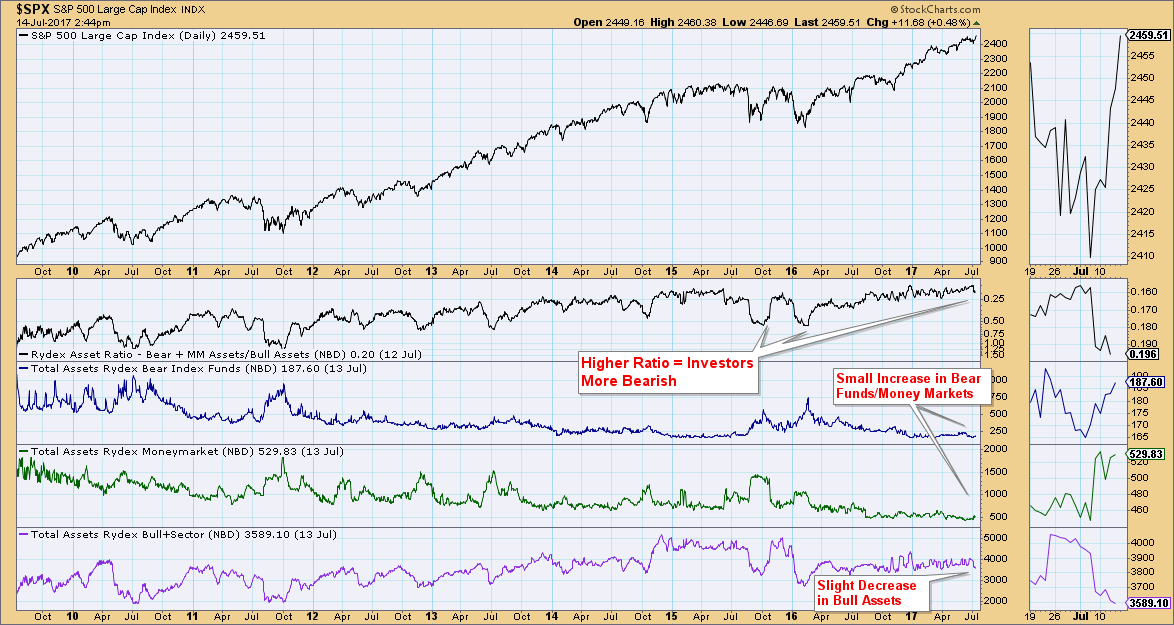
I love the Rydex Ratio charts. Rather than a "poll" to find out where investors and money managers stand, we can track the assets in the Rydex funds. This "poll" is about putting your money where your mouth is. We can see that investors are beginning to get a bit more bearish as the ratio is beginning to rise in value. In the thumbnail you can see that money is beginning to flow into bear funds and money markets and out of the bull and sector funds.
Conclusion: I mentioned at the beginning of this article that sentiment is contrarian. So one might ask if the sentiment is getting bearish, isn't that a good thing? It's a good thing when sentiment is very bearish as that typically proceeds a rally. Although I am seeing deterioration in bullish sentiment, I wouldn't say we are looking at wildly bearish poll numbers or asset movements. I think for now, the loss of blind exuberance may finally be diminishing and could very well be the beginning of a pullback.
Helpful DecisionPoint Links:
DecisionPoint Shared ChartList and DecisionPoint Chart Gallery
Price Momentum Oscillator (PMO)
Swenlin Trading Oscillators (STO-B and STO-V)
Technical Analysis is a windsock, not a crystal ball.
Happy Charting!
- Erin
**Don't miss DecisionPoint Commentary! Add your email below to be notified of new updates"**


