
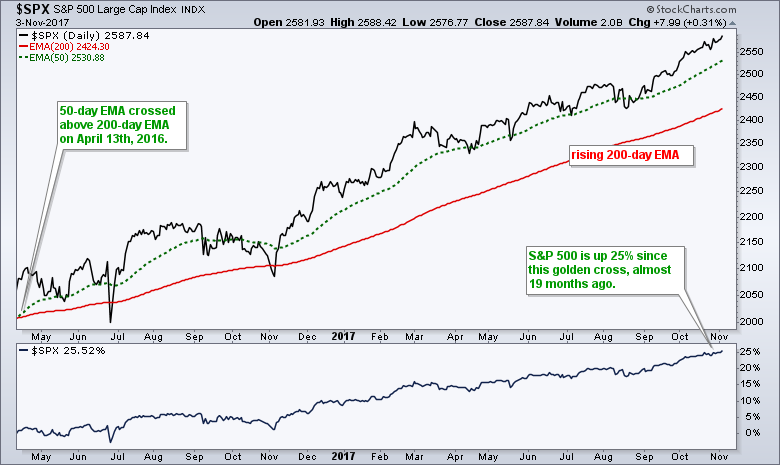
An uptrend means prices are advancing and higher highs are the order of the day. We do not know how long a trend will persist, but there is clear evidence that trends persist. Just look at the S&P 500 since early 2016 for a recent example. The 50-day EMA crossed above the 200-day EMA in April 2016 and this golden cross remains in play - some 19 months later and 25% higher. Dozens of stocks tell similar stories. Note that the 50-day EMA has been above the 200-day EMA for at least a year for 40 stocks in the S&P 100. Thus, 40% of stocks in the S&P 100 have been trending higher for at least a year. Trend identification is important because it dictates what we should ignore and what we should watch.
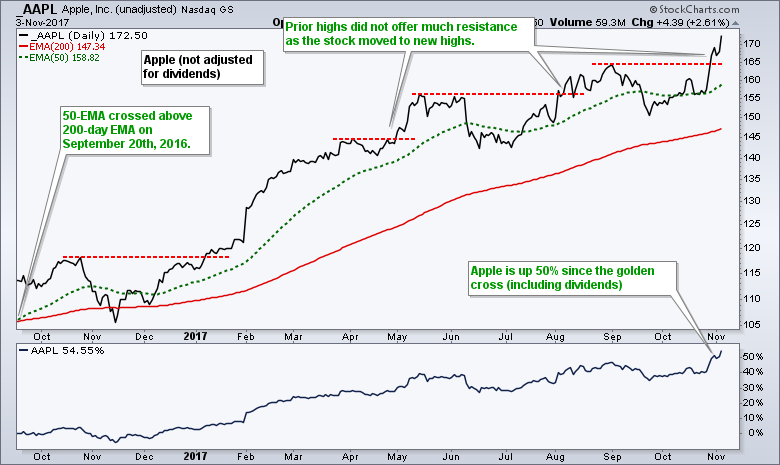
Chartists should ignore potential resistance levels during an uptrend. A price peak marks a level where selling pressure appeared and pushed prices lower. While one peak will eventually mark the final high of an uptrend, there will likely be several higher highs before an actual reversal. Prior peaks are unlikely to offer much resistance because the uptrend is the dominant force at work. In other words, a higher high is the norm in an uptrend, not the exception. We should, therefore, not be surprised when prices exceed their prior high. The chart below shows Apple starting an uptrend when the 50-day EMA moved above the 200-day EMA on August 24th, 2016. This golden cross is still holding and the stock is up over 50% since the initial signal. The red lines mark peaks along the way and these peaks did not offer much resistance.
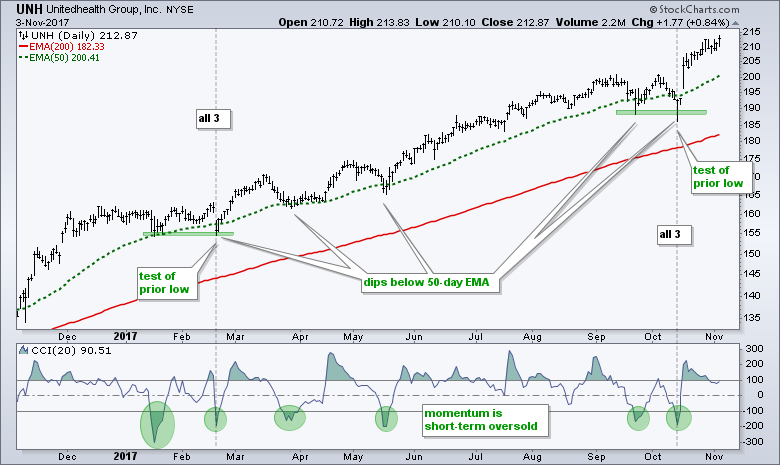
Chartists should watch for opportunities to participate in the ongoing uptrend. Pullbacks and corrections within an uptrend present such opportunities because the uptrend is expected to resume at some point. There are several ways to do this and I will show three techniques. Chartists can use the 50-day EMA, prior troughs or the Commodity Channel Index (CCI) to identify these opportunities. The chart below shows UnitedHealth Group (UNH) with some examples over the past year. UNH moved below the 50-day EMA five times, the Commodity Channel Index (CCI) moved below -100 six times and prices tested the prior trough twice. All three signals triggered simultaneously in late February and mid October.
As Charles Dow put it, the trend is in force until proven otherwise. Furthermore, neither the length nor the duration can be forecast. This is valuable information that chartists can use to streamline their analysis process. In general, we should ignore bearish patterns, bearish signals, overbought conditions and resistance when the trend is up. Instead, we should focus on bullish patterns, bullish signals, oversold conditions and support during uptrends.
Follow me on Twitter @arthurhill - Keep up with my 140 character commentaries.
****************************************
Thanks for tuning in and have a good day!
--Arthur Hill CMT
Plan your Trade and Trade your Plan
*****************************************


