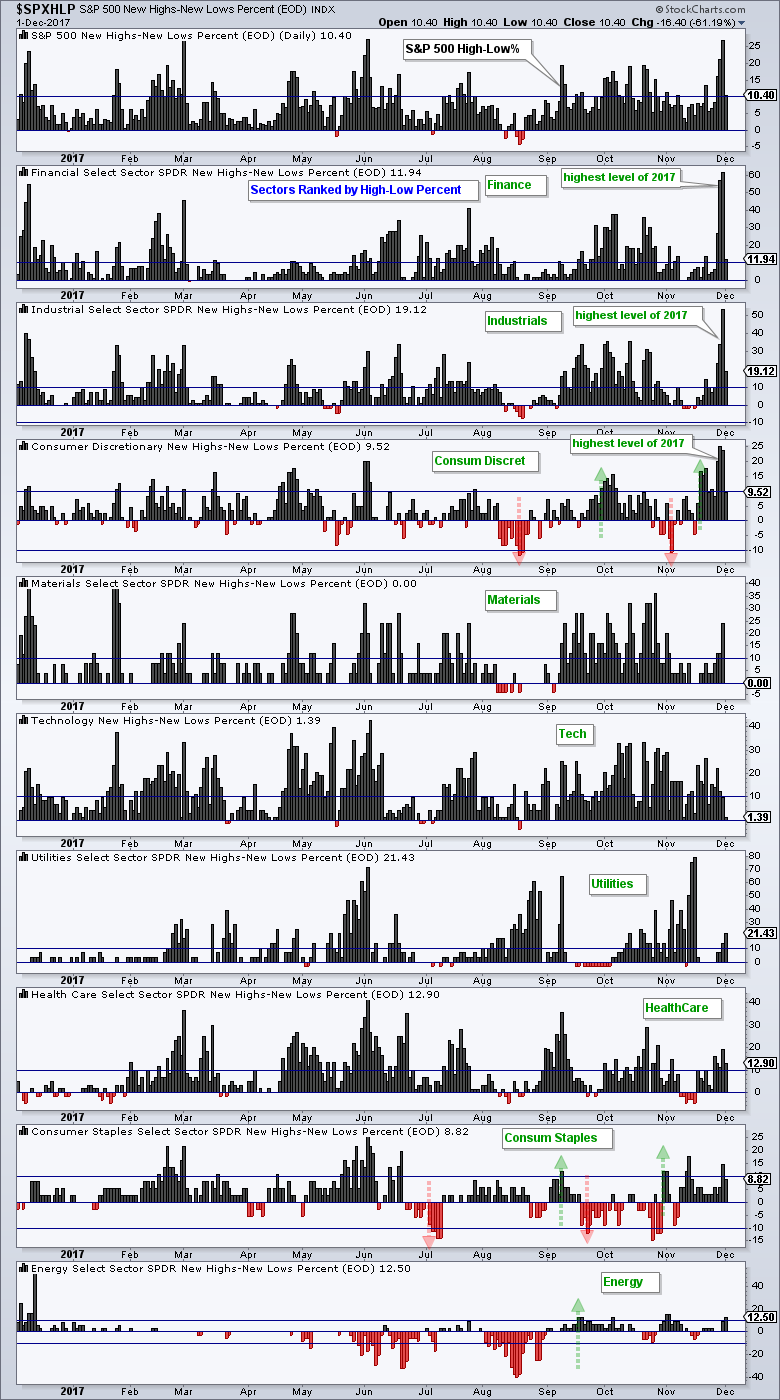
Chartists can plot High-Low Percent for the nine sectors to identify areas of strength within the stock market. The chart below shows the High-Low Percent ranked by this week's highest value. The finance, industrials and consumer discretionary sectors stand out this week because their High-Low Percent indicators hit the highest levels of the year. High-Low Percent for the finance and industrials exceeded +50%. Assuming virtually no new lows this week, this suggests that more than 50% of the stocks in these sectors hit new highs. XLY High-Low% ($XLYHLP) exceeded 20% the last three days and these are the highest readings since March 2015.

The blue horizontal lines mark the +10% and -10% levels for High-Low Percent on each chart. A move above +10% shows enough critical mass to turn bullish (green arrows), while a move below -10% is considered bearish (red arrows). According to this indicator, six of the nine sectors have been bullish the entire year. XLE High-Low% ($XLEHLP) turned bullish in mid September. XLP High-Low% ($XLPHLP) and XLY High-Low% ($XLYHLP) were whipsawed the last few months, but both are on bullish signals now.
Follow me on Twitter @arthurhill - Keep up with my 140 character commentaries.
****************************************
Thanks for tuning in and have a good day!
--Arthur Hill CMT
Plan your Trade and Trade your Plan
*****************************************
