 I haven't talked Small Caps in quite awhile and I think there are some interesting points that need to be made--good and bad. First, the technicals on the S&P 600 are not looking good at all. However, Tom Bowley, my co-host on MarketWatchers LIVE and fellow blogger showed us the seasonality of the small caps is very bullish for the end of December. So the question is...Will Santa Claus deliver a rally in the small caps? My indicators are making the case that we won't see Santa for IJR (SP600 ETF) or he'll be running late.
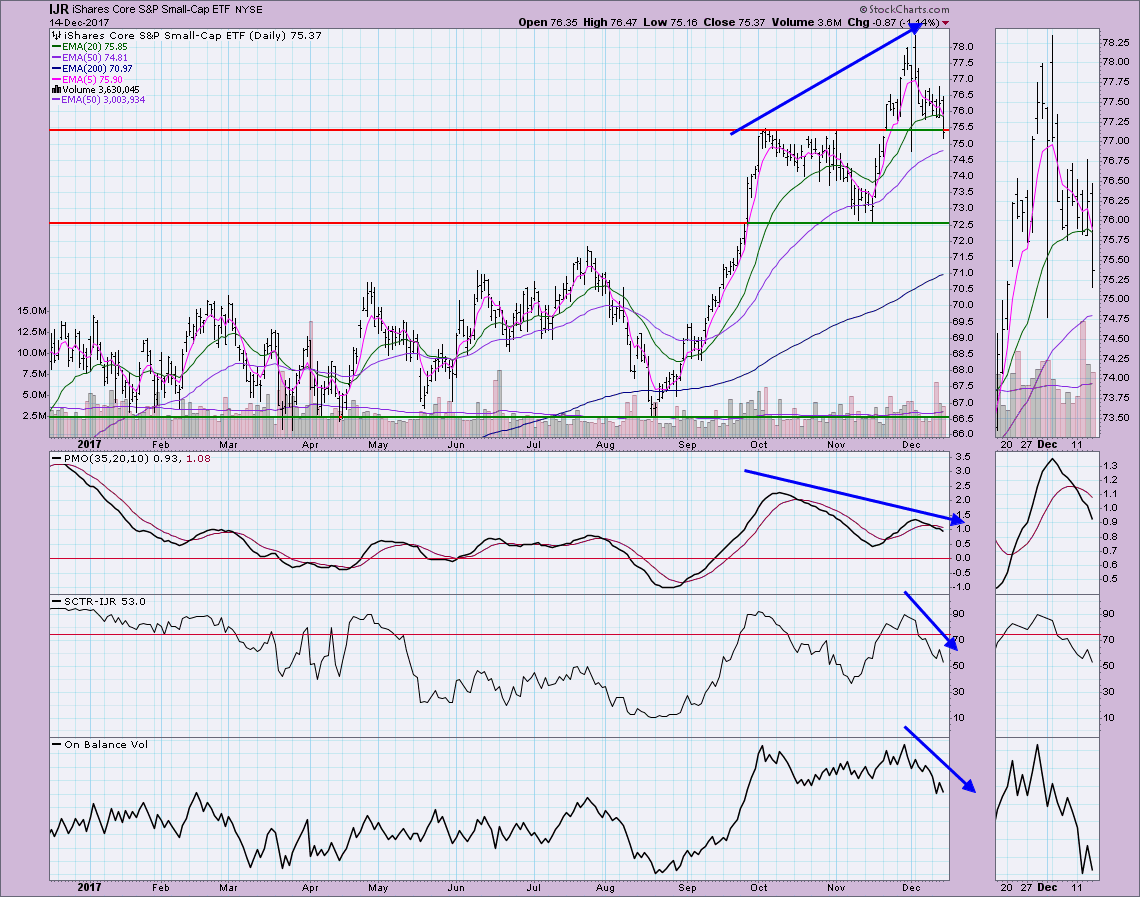
The daily chart looks bearish. We have a negative divergence in play between the PMO tops and price tops. The good news is that it is clinging to support around $75.50. However, with a PMO SELL signal and SCTR and negative volume dragging the OBV lower--a rally here doesn't seem too likely.
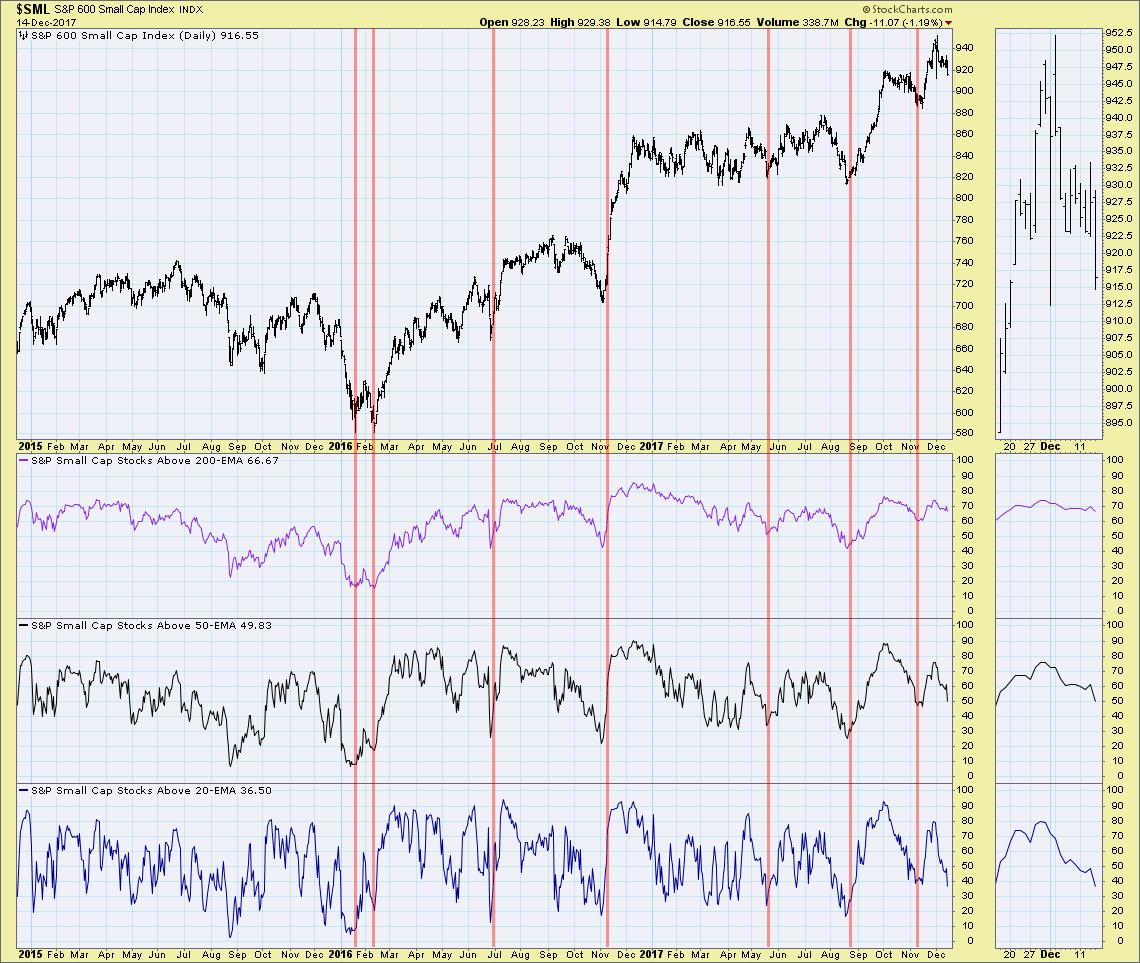
In the DecisionPoint Straight Shots ChartPack (free!)**, we have not only the daily charts for $SML, but also corresponding indicators. I wanted to point out two in particular; however, if you look at more, you'll not see much to be bullish about. I like this simple chart of how many of the 600 stocks are above their 20/50/200-EMAs. It gives us a complete picture in all three timeframes, what is happening. In the longer term, we see that 1/3 of the 600 have price below the 200-EMA. Less than half of the members are above their 50-EMA and only a little over 1/3 are above their 20-EMA. These readings are getting near-term oversold but they can ALL move much lower. This chart deserves a close watch. You can see that when these indicators bottom, it is very accurate on calling upcoming rallies. They're not even decelerating right now.
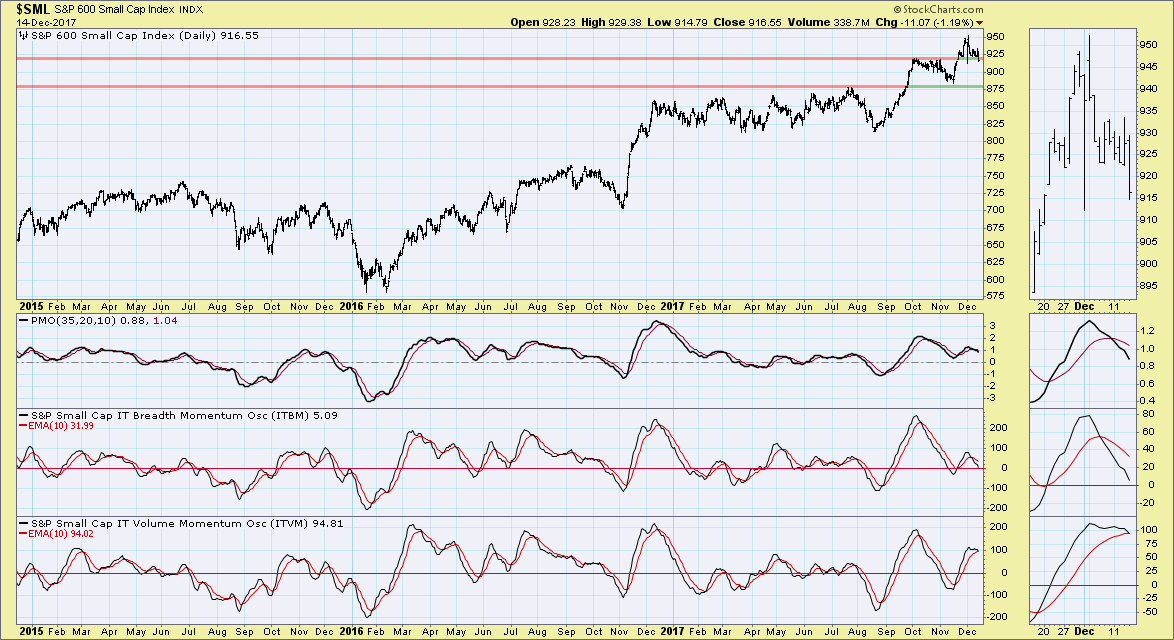
The ITBM and ITVM are configured negatively with a negative crossover that occurred earlier this month and a likely negative crossover on the ITVM. Neither is particularly oversold. This certainly suggests a rough finish to the year.
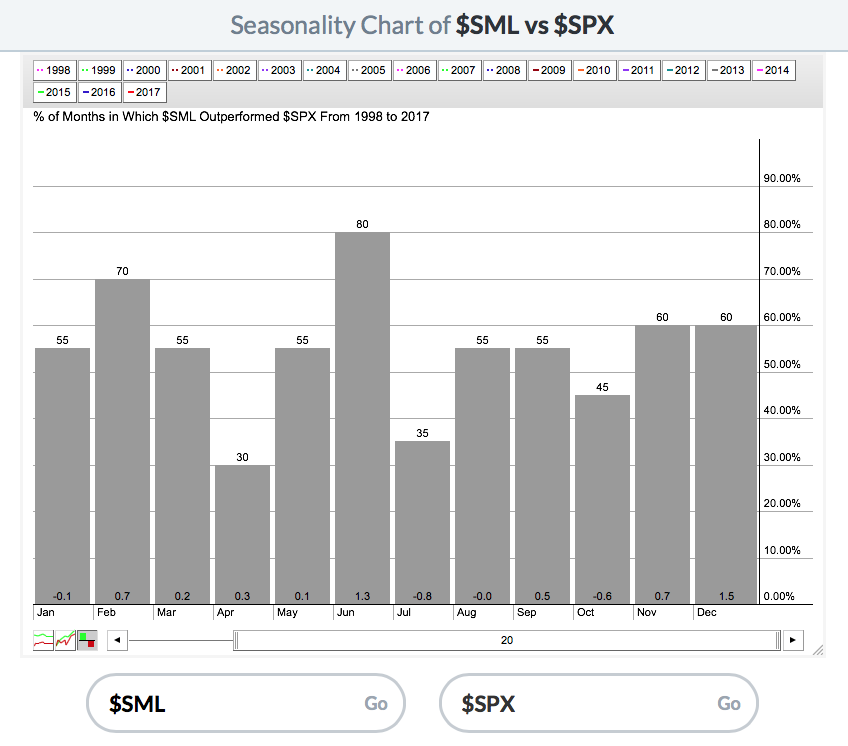
Tom wrote an excellent article on the historical tendencies of small cap indexes in the Trading Places blog. He showed a version of the seasonality chart below during our show that does show that in December, 60% of the time it outperforms the SPX by an average 1.5% and 70% of the time for IWM (Russell 2000 ETF). Nothing to sneeze at.
Conclusion: While I think seasonality is thought provoking for the small caps, I have trouble moving bullish when the indicators are so bearish. Ultimately, we know there is a strong bull market still in effect, but I think that rather than a pause like the SPX, we probably will see a decline in small caps. We do want to keep an eye on the DecisionPoint indicators for $SML because while they are bearish right now, they are about to reach turning points that could clue us in to a new rally.
** To download DecisionPoint ChartPacks, you need to be an Extra member or above. You'll find them in the "Your Account" link.
Helpful DecisionPoint Links:
DecisionPoint Shared ChartList and DecisionPoint Chart Gallery
Price Momentum Oscillator (PMO)
Swenlin Trading Oscillators (STO-B and STO-V)
Technical Analysis is a windsock, not a crystal ball.
Happy Charting!
- Erin
**Don't miss DecisionPoint Commentary! Add your email below to be notified of new updates"**


