- Lithium LIT
- Rare Earth Metals REMX
- Steel SLX
- Coal KOL
- Book starts shipping next week!
Lithium, Steel and Rare Earth Metals all had a pretty good 2017. Each week on Commodities Countdown, I roll through the commodity markets. Steel (SLX) and Coal (KOL) have been performing well recently, but this week has slowed most charts. Lithium was an all-star performer in 2017 but looks shakier here. If you are a fundamental investor, you are in love with Lithium because of the electric car battery potential. Rare Earth Metals have also been rising on some of these fundamental factors.
But this isn't a fundamental based article. This is an article about what investors are doing with their money. Behavioural Finance is the fancy terminology for watching price action. So let's look a little closer at Lithium (LIT) and Rare Earth Metals (REMX) charts.
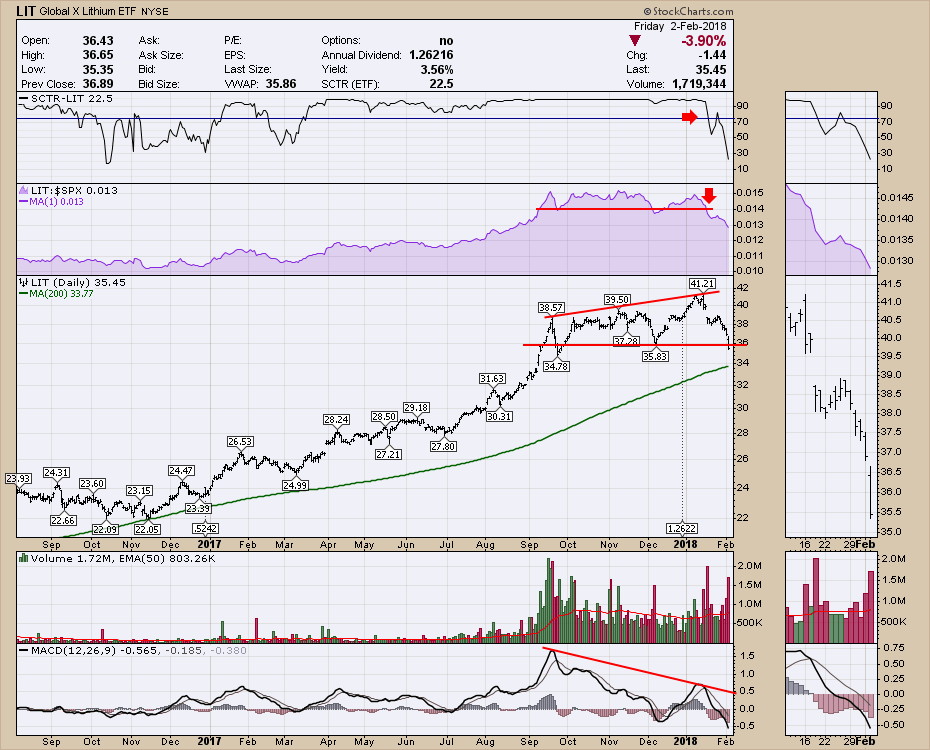
Lithium (LIT). This chart is broken. The SCTR has recently fallen out of the top zone. The relative strength (RS) in purple is at 5-month lows. What does that mean? Compared to the $SPX, the stock has underperformed the index and is getting weaker. Remembering the $SPX has been a raging bull, it has been a tough comparison. But you can see that this weakness has been setting up for a while. The three month RS low in December was a warning shot. Now it looks set to continue.
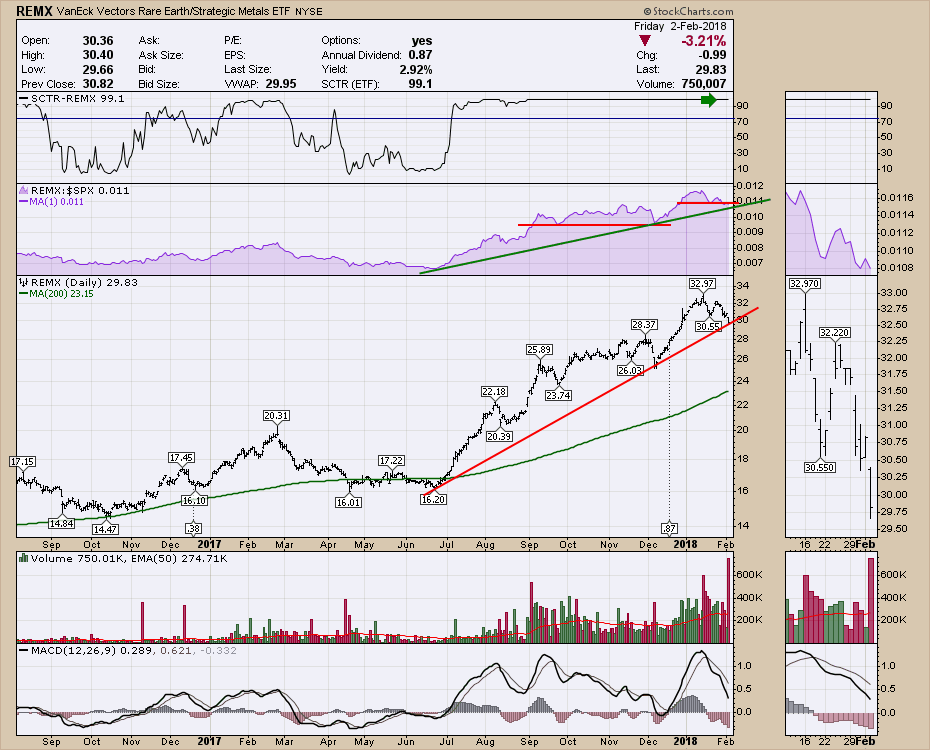
Rare Earth Metals (REMX) have also done well in 2017. But, near year, new look. Actually, the chart looks great but we are at a couple of different decision points.
- The trend line is in play after Friday's down day.
- The selling volume was pretty extreme on this chart so it suggests the support is waning. The volume was almost 3 times the normal volume on Friday.
- Just as a comparison, the SLX and KOL charts mentioned below had average volume on Friday.
- Price is at one-month lows and has been drifting lower since early January.
I find the SCTR ranking to be a little late on selling signals. I would prefer the relative strength (RS) in purple to help sell. RS is back to one month lows, even though January was a big bull month for the broader market. While I don't have a sell signal on the SCTR, the relative strength or the price action, it is cautionary because of the heavy volume on down days in the last month and the trend line test Friday. Also notice how few up days there have been in the last month which is a huge contradiction to the overall market. Sentiment towards this chart seems to be waning. Caution is advised, but not a sell recommendation yet. Keep your stops close.
 SLX and KOL both look good, but steel rolled down pretty hard this week. If you would like a bigger view of some of the Commodities, I would encourage you to watch Commodities Countdown 2018-02-01. Big changes this week, even as oil went to new highs. For Canadian investors, the $TSX has been breaking down long before Groundhog day. For more information on that, Canada goes negative for the year.
Lastly, the StockCharts.com bookstore will be shipping out copies of my new book, Stock Charts For Dummies late in the week. For beginners, it is a welcome introduction to the art of charting. For experts, it highlights tips and tricks to make your charting faster and easier. I regularly speak to portfolio managers who have questions about charting. Lots of those questions are answered in the book.
For Canadian customers, use Indigo.ca or Amazon.ca as the customs charges and international shipping charges are prohibitive.
The first review is in on Amazon.ca and it is 5 stars! When you read the book, please circle back and review it on Amazon.ca and Amazon.com. It helps people considering the book understand more about it.
Good trading,
Greg Schnell, CMT, MFTA


