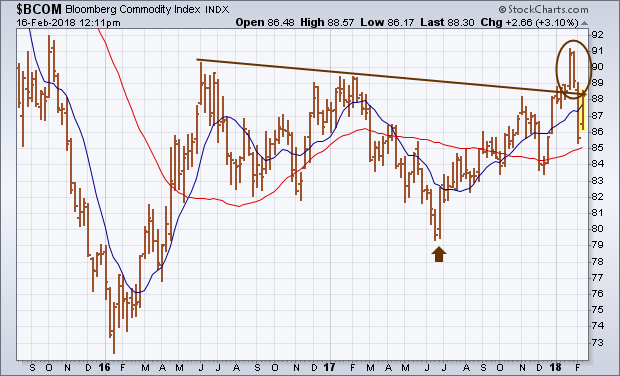
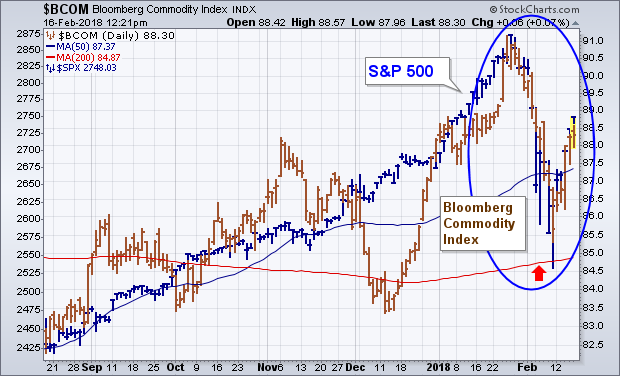
My January 27 message wrote about a bullish breakout in commodity prices to the highest level in two years. I took that as another sign that inflation pressures were starting to build. The weekly bars in Chart 1 show that bullish breakout taking place in the Bloomberg Commodity Index (circled area). During February, however, commodity prices have sold off enough to call that upside breakout into question. In my view, it probably doesn't. Commodity prices have been rising on signs of a growing global economy which increases demand for raw materials. As a result, commodities and stock prices have been more or less rising together over the past two years. That was especially true since last June when commodity prices turned up (brown arrow). The daily bars in Chart 2 show, however, that the commodity drop during February coincided with a 10% drop in the S&P 500 (blue bars). The 20-day correlation between the two markets jumped to .90 during that selloff. Chart 2 also shows the BCOM bouncing off its 200-day moving average last Friday as did the S&P 500 (red arrow). Both are rising together this week. Economically-sensitive industrial metals are leading the commodity recovery this week (while crude oil lags behind). Gold is also starting to play a leading role in the commodity revival.


