Editor's Note: This article was originally published in John Murphy's Market Message on Thursday, April 19th at 12:11pm ET
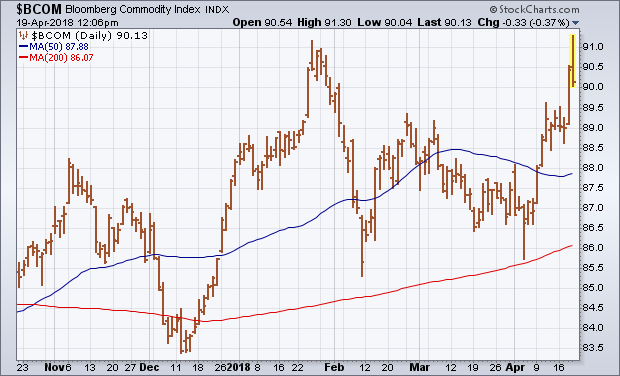
BLOOMBERG COMMODITY INDEX IS NEAR AN UPSIDE BREAKOUT... This week's surge in commodity prices is starting to attract a lot of attention. That's because rising commodity prices are a leading indicator of inflation. Rising commodity prices have a lot of intermarket implications. For one thing, rising commodity prices usually cause Treasury bond prices to fall and yields to rise (as they're doing today). That usually helps stocks tied to commodities and those that benefit from rising rates (like banks and financials). But it would hurt rate-sensitive bond proxies like staples, utilities, and REITS. Rising bond yields could, however, cause the yield curve to steepen and relieve recent concerns about it falling to the lowest level in a decade. Let's look at some charts. Chart 1 shows the Bloomberg Commodity Index ($BCOM) testing overhead resistance at its January high. After opening higher this morning, the BCOM is pulling back a bit. That's a very important test because a close above its January high would put it at the highest level in more than two years. [The CRB Index has already reached a two-year high]. The BCOM is composed of 22 commodity futures. Energy is its biggest group with a weight of 30%. Crude oil has already reached a three-year high. Industrial metals -- which include aluminum, copper, nickel, and zinc -- have jumped sharply this week. Aluminum has reached a six-year and nickel a three-year high. Copper prices are also rising. Precious metals are being led higher by silver and palladium. That's giving a boost to metal miners.
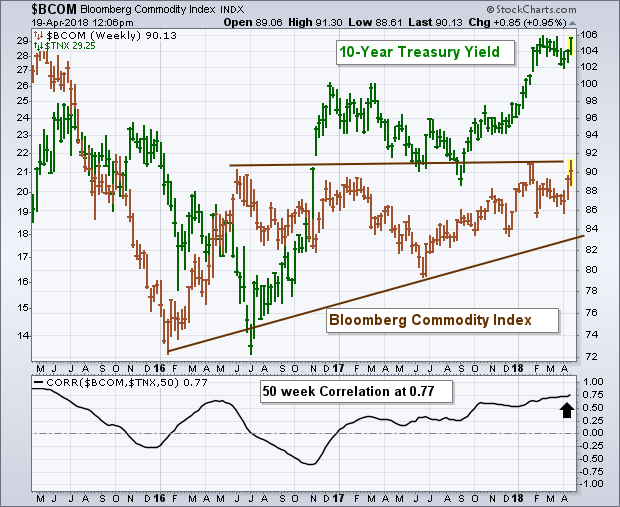
 BOND YIELDS AND COMMODITIES ARE LINKED... Inflation is one of the biggest drivers of bond yields. And commodities are a leading indicator of inflation. So it's reasonable to suggest that there's a link between rising commodity prices and rising bond yields. Since the 2008 financial crisis, bond yields and commodities mostly fell together as the global economy fought off deflation (leading to global quantitative easing to boost prices). Over the last two years, however, those trends have been changing. The brown bars in Chart 2 show the Bloomberg Commodity Index hitting bottom at the start of 2016 and going through a process of base building since then. An upside breakout from current levels would put the BCOM at the highest level since late 2015 and would signal that commodities are moving higher. The green bars show the 10-Year Treasury yield hitting bottom in mid 2016 and reaching a three-year high by the start of 2018. It seems reasonable to assume that an upside breakout in commodities would push bond yields even higher. The lower box in Chart 2 shows the 50-week Correlation Coefficient between the two markets to be .77 and rising. That means that the traditional linkage between the two markets is getting even stronger.
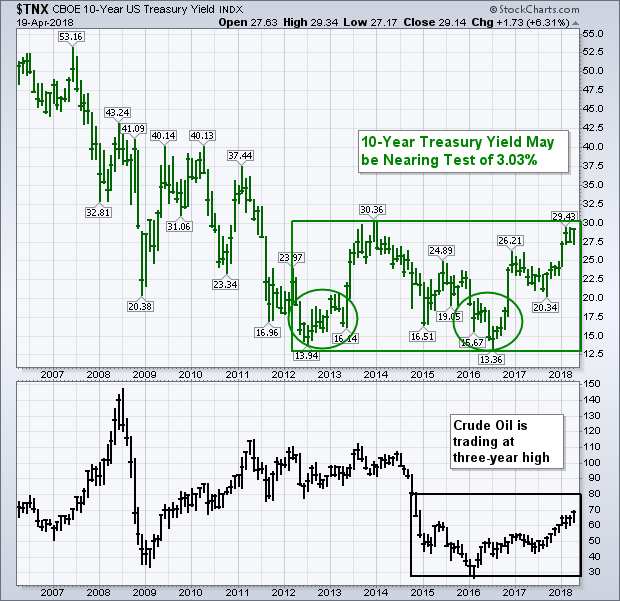
 TEN-YEAR TREASURY YIELDS MAY BE HEADED FOR TEST OF 3.00%... The 10-Year Treasury yield is climbing 5 basis points today to 2.92% which puts it within striking distance of its January intra-day high at 2.94%. If it breaks through that level (which seems likely) that would set up an even bigger test of its late 2013 intra-day high near 3.03.%. The green boxed area on Chart 3 shows the TNX forming a "double bottom" that started in 2012 followed by a retest during 2016 (two circles). The TNX now appears headed higher to test the upper boundaries of that bottoming pattern near 3%. Any chart reader knows that a decisive close above that previous peak would complete a major bottom in bond yields which would signal higher bond yields (and lower bond prices). The black monthly bars in the lower box show crude oil already trading at the highest level in three years. The 12-month Correlation Coefficient between the two markets is very high at .91. And crude oil carries the most weight in most commodity price indexes. That suggests to me that an energy led upside breakout in commodity price indexes would greatly increase the risks that bond yields could start to climb a lot higher. Rising bond yields might cause some nervousness among stock traders. But it could also cause the 10-2 year yield curve to steepen (as it's doing today) which could lessen fears of a slowing economy. Rising bond yields would also favor some stocks sectors while hurting others as described in paragraph one. The biggest losers in that scenario would be bondholders.


