The start of every quarter represents a big opportunity to me and the reason is simple. Historically, the odds favor a bullish move into earnings season. Before we consider which individual stocks might be poised for a solid advance, let's take a look at history and the Volatility Index ($VIX).
History is fact and indisputable. It doesn't guarantee future results, but it does provide us a seasonal roadmap. We know that earnings are a key factor in the direction of stock prices and we know that earnings tend to rise over time. We also know, or should know, that the stock market looks ahead. Price reflects the anticipation of economic conditions, earnings, Fed policy, etc. So it therefore would make sense that if the stock market is anticipating better-than-expected earnings, we would see better-than-average market returns on the days leading up to earnings season. I know from my study of history that the stock market performs best from the 26th of one calendar month to the 6th of the following calendar month. It also performs well from the 11th to the 18th calendar days. So for purposes of the "pre-earnings run up", I'm calculating historical returns from the 26th of one quarter's end to the 18th calendar day of the next quarter. The 18th is close in proximity to when earnings season typically begins so I believe this historical information provides a great pre-earnings look at the market.
So let's review annualized returns from December 26th to January 18th, March 26th to April 18th, June 26th to July 18th and September 26th to October 18th. Here's what history tells us, by quarter:
Q1 Pre-Earnings Advance (December 26th through January 18th)
S&P 500 (since 1950): +17.81% (vs. 9% average return throughout the year)
NASDAQ (since 1971): +44.20% (vs. 12.46% average return throughout the year)
Q2 Pre-Earnings Advance (March 26th through April 18th)
S&P 500 (since 1950): +20.03%
NASDAQ (since 1971): +12.96%
Q3 Pre-Earnings Advance (June 26th through July 18th)
S&P 500 (since 1950): +15.97%
NASDAQ (since 1971): +26.39%
Q4 Pre-Earnings Advance (September 26th through October 18th):
S&P 500 (since 1950): +9.05%
NASDAQ (since 1971): +3.99%
The S&P 500 is consistently producing annualized returns ahead of earnings season that exceed average returns throughout the year. Q4 is an exception as the end of September is typically weak, reducing the size of annualized returns from September 26th through October 18th.
Then there's volatility. In my opinion, the biggest issue in the market right now is the VIX. High volatility means wild trading and we've certainly witnessed that in the past couple months. When the VIX is in the 9-12 range, the market routinely ignores bad news, confounding the bears. But when the VIX is elevated and above the 16-17 level, you must be prepared for sudden shifts in both directions as emotional trading takes over. Currently, the VIX is at 21.49. Instead of ignoring bad news and headlines, the high VIX intensifies it. The market feeds off of anxiety and fear. Personally, I slow my trading down when the VIX is high. Yes, you can earn much higher returns in a market that moves quickly, but it wouldn't be wise to ignore the associated risk of losing capital quickly.
As I posted in my daily Trading Places blog on Wednesday, we're in a Volatility War more than anything else. That suggests that we should be trying our best to minimize risks. That could mean trading more ETFs and avoiding individual stocks. It could mean trading fewer shares than normal and maintaining higher cash levels. It could mean trading lower beta stocks. It could mean lots of things, depending on your own personal trading style and strategy. But to trade a high VIX market the same as a low VIX market is a big mistake in my opinion.
So let's get to individual stocks that reported excellent earnings in the last quarter, but have been shunned during Q1's high volatility. They could be preparing for a stellar run into their next quarterly earnings report.
1. Snap, Inc. (SNAP)
SNAP reported much-better-than-expected results in its last quarter and the market's response was quite bullish. We have completely filled the gap created from those earnings and printed a reversing piercing candle to potentially signal the start of a pre-earnings run higher:
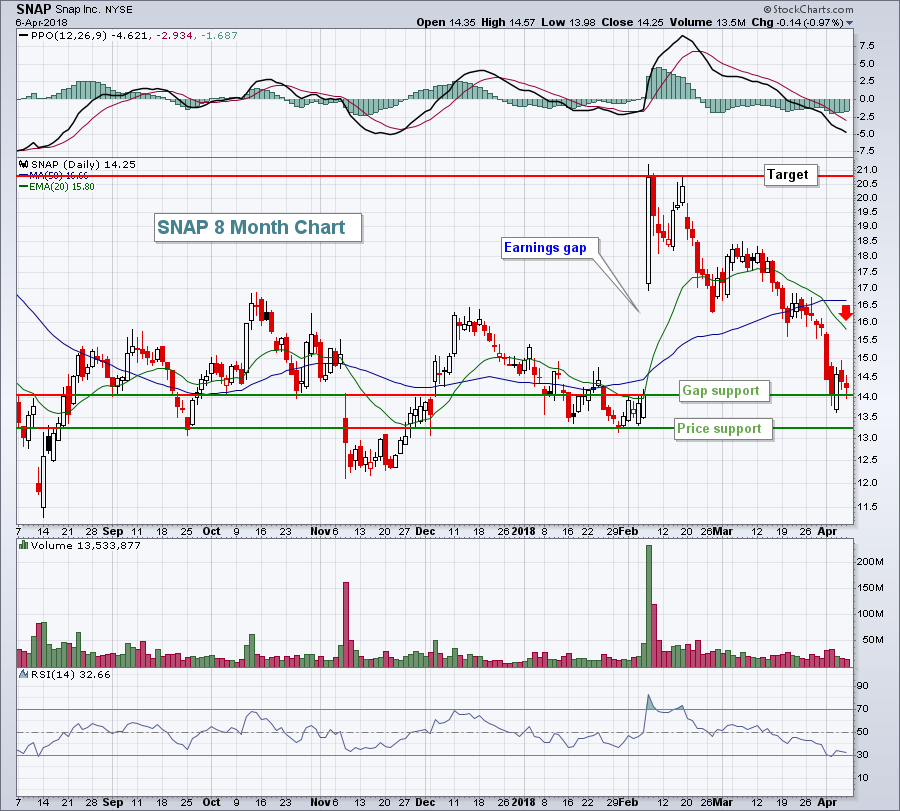 While I've provided key price levels - target, gap support, price support - a significant level to negotiate will be the declining 20 day EMA (red arrow). I've traded SNAP a few times in recent months as it's on my Strong Earnings ChartList. I've had mixed results, but am looking for a move higher into earnings.
(Disclosure: I own SNAP)
2. William Lyon Homes (WLH)
First, it's important to realize that home construction ($DJUSHB), which had been a relative laggard in 2018, has come back to life in April. WLH produced excellent quarterly results on February 20th, beating both top line and bottom line Wall Street consensus estimates. The reaction to its solid earnings report was muted as home construction was completely out of favor at the time. But WLH has broken out of a consolidation range and appears poised for further gains into its next earnings:
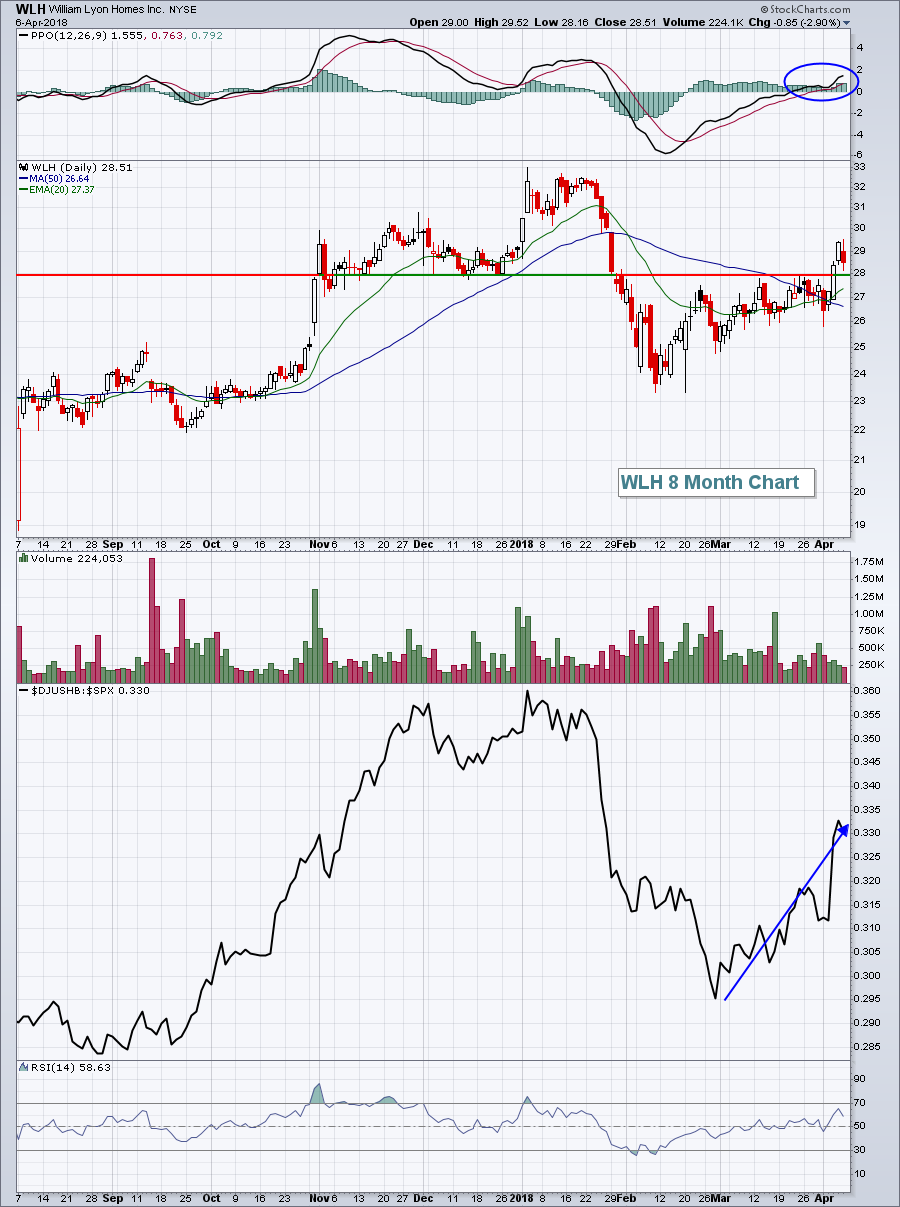 Momentum has turned bullish, as evidenced by the PPO centerline crossover and you can see that the DJUSHB has been steadily outperforming the benchmark S&P 500 for the past 5-6 weeks. That combination is likely to see sustained outperformance by WLH as its next earnings date approaches.
I'd like to invite you to join me and John Hopkins, President of EarningsBeats.com, for a highly educational webinar on Monday, April 9th at 4:30pm EST. I will be unveiling at least another dozen stocks, similar to SNAP and WLH above, that I believe have a solid chance to make a serious pre-earnings run higher. The webinar is FREE and these are just a couple of the major benefits you'll receive from attending:
(1) I'll demonstrate how I set up my Strong Earnings ChartList
(2) If you're a StockCharts.com member, I'll send you my Strong Earnings ChartList, eliminating the dozens of hours of homework to set up this list. You must be a StockCharts.com member in order to transfer this list. If you're not currently a StockCharts.com member, you can sign up for a free 30 day trial.
Webinar seating is limited so please register NOW to save a spot as it will fill up. To register for this event, CLICK HERE.
I hope to see you there!
Happy trading!
Tom


