Small-cap stocks and indexes are quite healthy, far more than the large-cap indexes which are lagging behind. During today's MarketWatchers LIVE show and in my Wednesday "DP Alert" blog article, I discussed the SPX's short-term bearish indicators contrasted with the now bullish short-term indicators for $SML. Not many of you are aware, but the Swenlin Trading Oscillators are available for most of the major indexes including $SML which I'll cover today. For more information, go to "Your Account" and manage your ChartPacks to download the DecisionPoint Straight Shots ChartPack. There you can get complete indicator sets for SPX, Nasdaq, NDX, SP100, SP400, SP600, and NYSE.
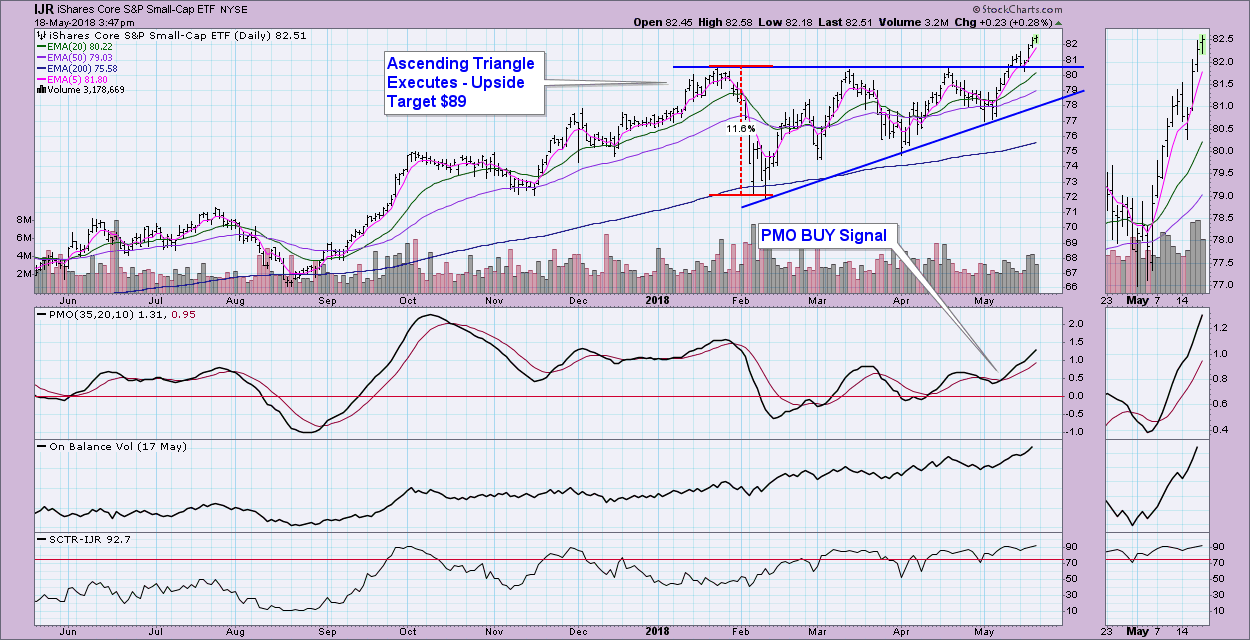
The SP600 ETF, IJR, shows the execution of an ascending triangle. Some textbooks say that you can calculate an upside target by measuring the height of the pattern from the low to the horizontal resistance line of the pattern. This would suggest that IJR could make a run up to $89.
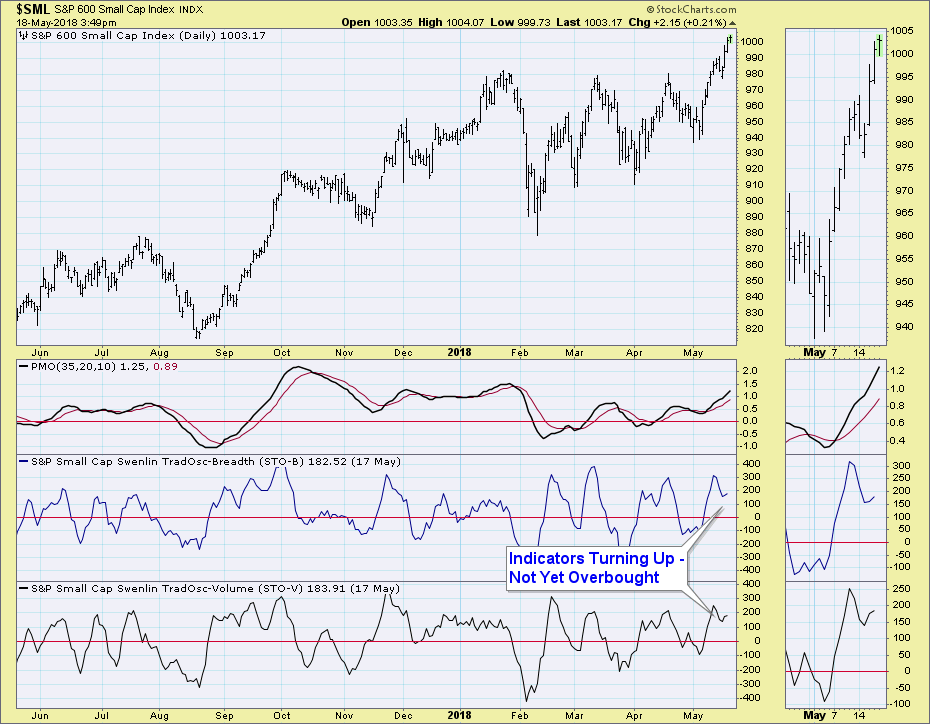
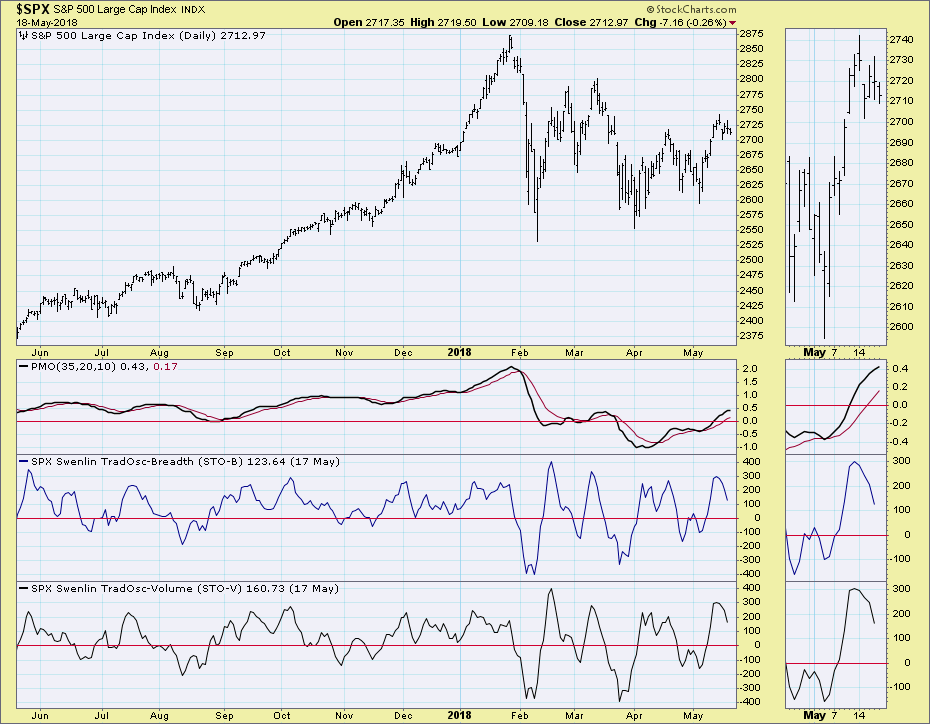
The STOs for the SPX are still in decline, but we can see that they have both turned up on the $SML chart. This suggests that this rally should continue.
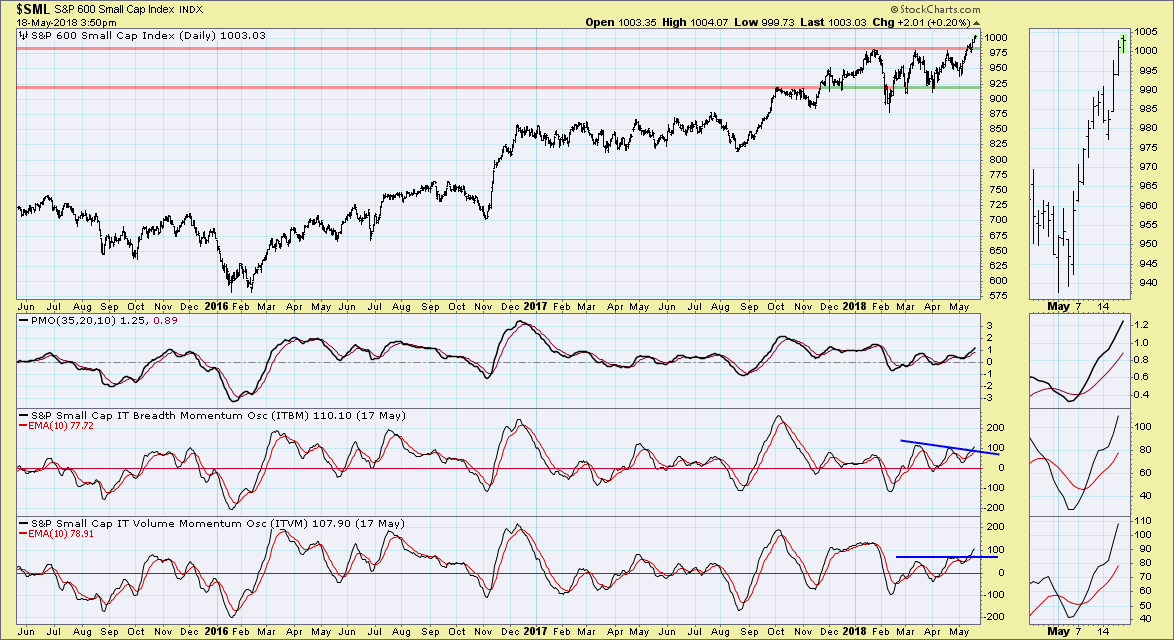
The short-term picture is bullish, but the intermediate-term picture is even better right now. Note that the ITBM is just about ready to breakout for the declining trend and the ITVM is moving effortlessly higher, suggesting that volume is behind this rally.
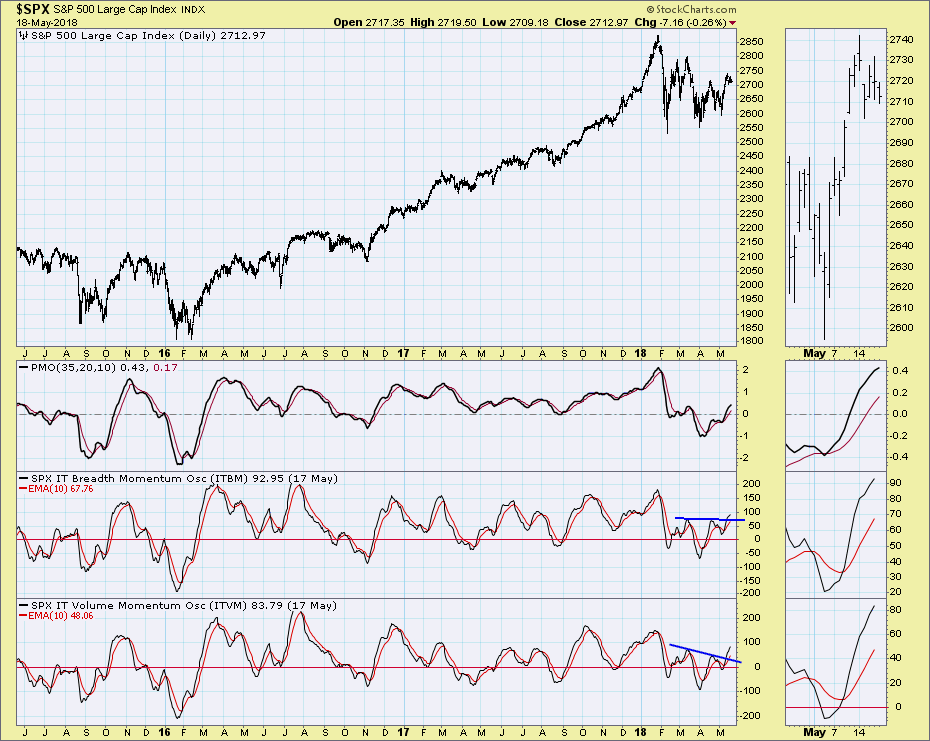
Conclusion: The market may appear bifurcated given the success of small-caps v. large-cap indexes. A rising Dollar tends to suppress large-cap gains since many large-cap companies do business overseas where a rising Dollar increases their costs. It may take a bit more effort to ignite large-caps, but given small-cap success, I'm optimistic. Additionally, the large-cap intermediate-term indicators are also bullish, with a similar look to the $SML's ITBM and ITVM which are rising and breaking out.
Technical Analysis is a windsock, not a crystal ball.
Happy Charting!
- Erin
Helpful DecisionPoint Links:
DecisionPoint Shared ChartList and DecisionPoint Chart Gallery
Price Momentum Oscillator (PMO)
Swenlin Trading Oscillators (STO-B and STO-V)
**Don't miss DecisionPoint Commentary! Add your email below to be notified of new updates"**


