Editor's Note: This article was originally published in John Murphy's Market Message on Wednesday, August 29th at 12:33pm ET.
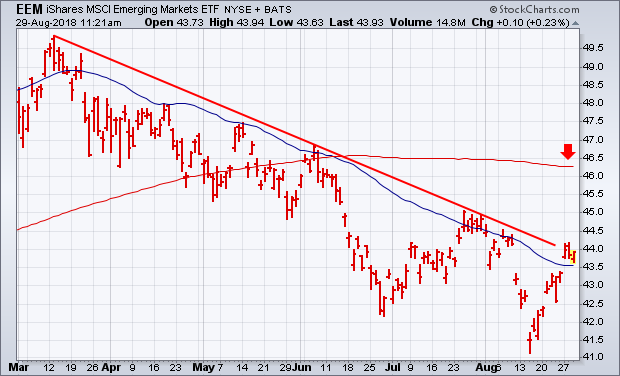
Before leaving on vacation on August 15, I expressed concern about the fact that foreign stock ETFs were lagging too far behind the U.S. which could threaten the uptrend in the S&P 500 which was nearing a test of its January high. The message suggested that U.S. stocks needed more help from foreign stocks in order to reach new highs. In the two weeks since then, foreign stock ETFs have actually risen more than in the states. That helped support new highs by the S&P 500 and most other U.S. stock indexes. In addition, the August upturn has taken place in both foreign developed and emerging markets. Chart 1 shows the MSCI EAFE iShares (EFA) jumping nicely since mid-August and rising back above its 50-day average. The EFA (which includes Europe Australasia and the Far East) is now challenging a falling trendline drawn over its May/July peaks, and isn't far below its 200-day moving average (red arrow). Needless to say, an upside breakout would be good for it and the rest of the world. Chart 2 shows the MSCI Emerging Markets iShares (EEM) also ending the month of August on a strong note. The EEM has climbed back over its 50-day average (blue line), and is now challenging a falling trendline extending back to its March high. There again, a move above that resistance line would improve the outlook for emerging market stocks and the rest of the world. Both foreign stock ETFs got an added boost by a drop in the U.S. Dollar Index which peaked on August 15 and has lost more than -2% since then. That's because foreign ETFs are priced in dollars and do better when the dollar is dropping. A weaker dollar has also taken some pressure off emerging market stocks and currencies. Some improvement on the trade front has also been supportive.
Chart 1
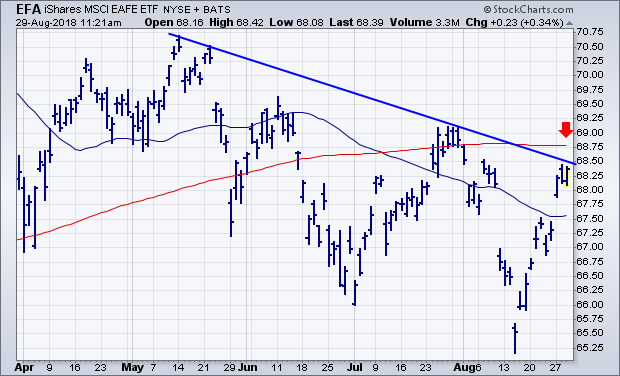
Chart 2