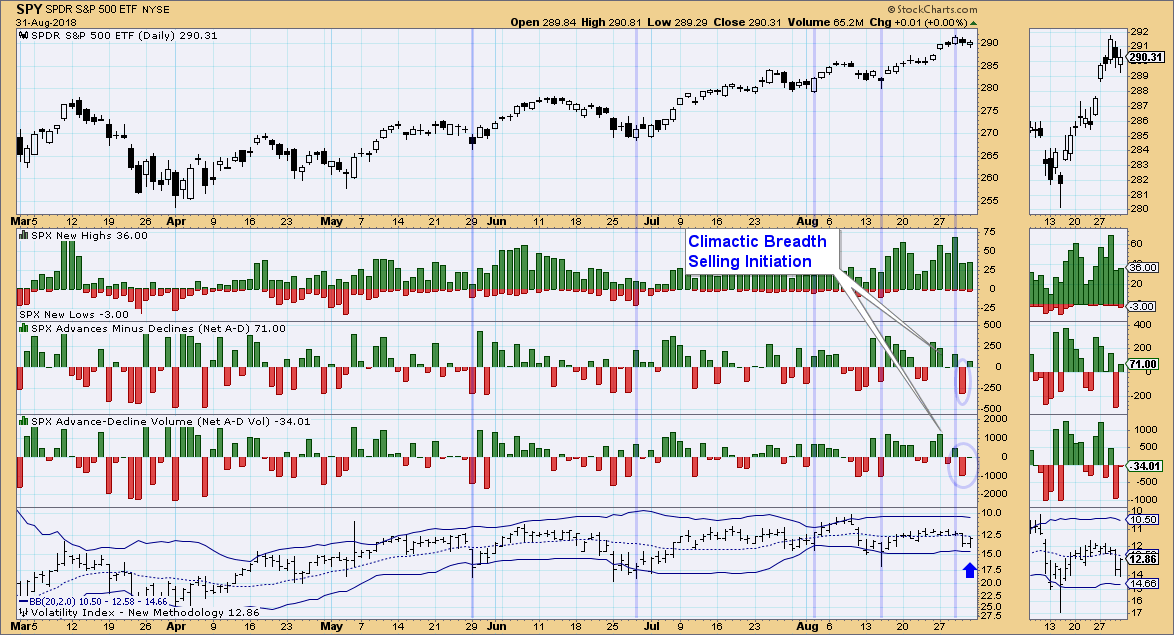
The market made new all-time highs this week, but with the upcoming holiday and short trading week, look for consolidation or continued sell-off. The indicators in the very short term and short term are suggesting a selling initiation. Add to that the highly bullish sentiment charts and it spells weakness in the week ahead.
The ultra-short-term indicators of breadth and the VIX show declining breadth numbers. Granted today advances did outrun declines, but the reading is still lower than the previous positive readings from earlier in the week. The VIX is getting very close to the lower Bollinger Band and a penetration would be a bullish sign, but until then these indicators are suggesting more weakness for the coming week.
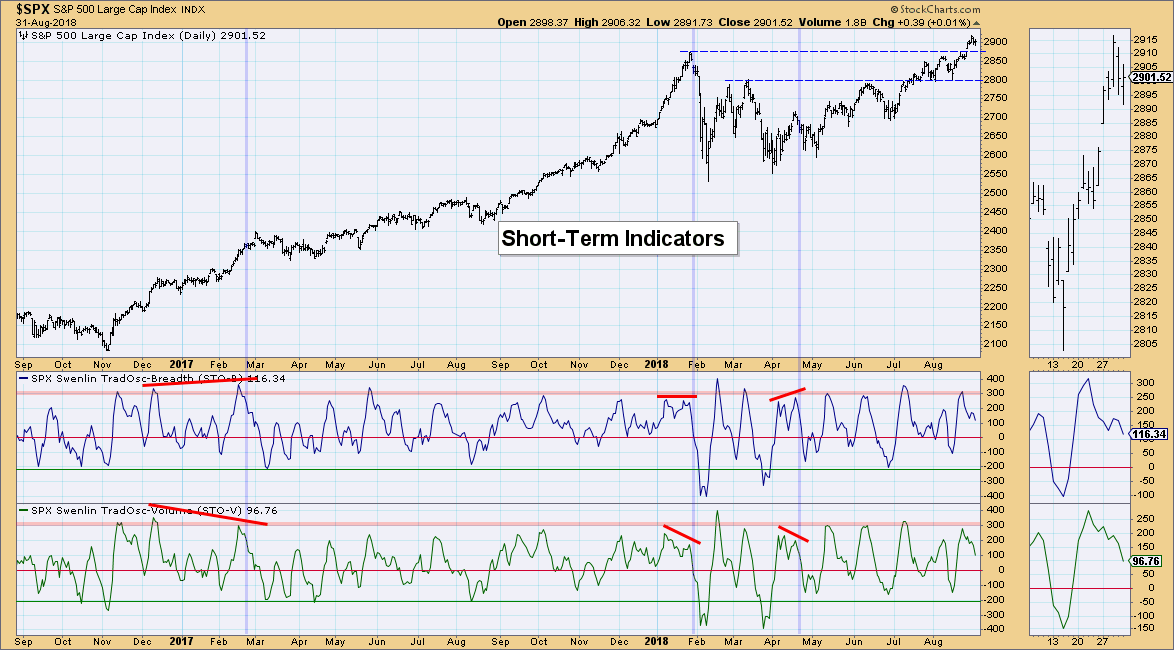
Short-term indicators are on their way lower and are far from being oversold or even neutral. They can certainly accommodate more downside.
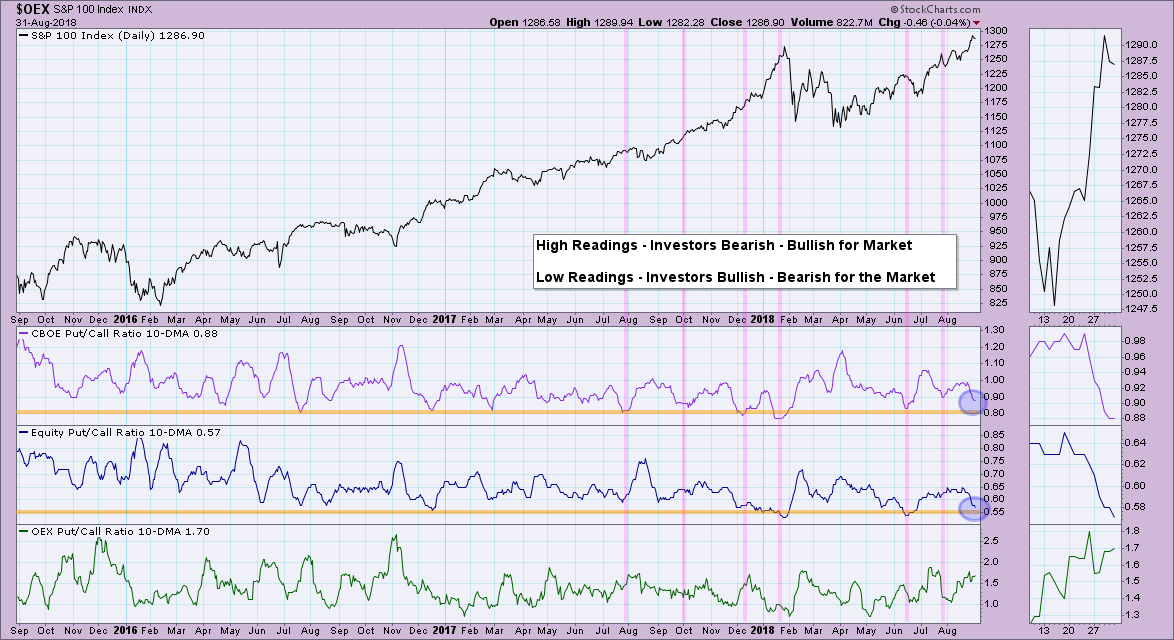
Looking at the 10-DMA of the put/call ratio, we can see that bullishness is expanding as they continue lower toward 'oversold' territory. Remember that sentiment is contrarian, so the bullish participants are, the more likely a downside reversal.
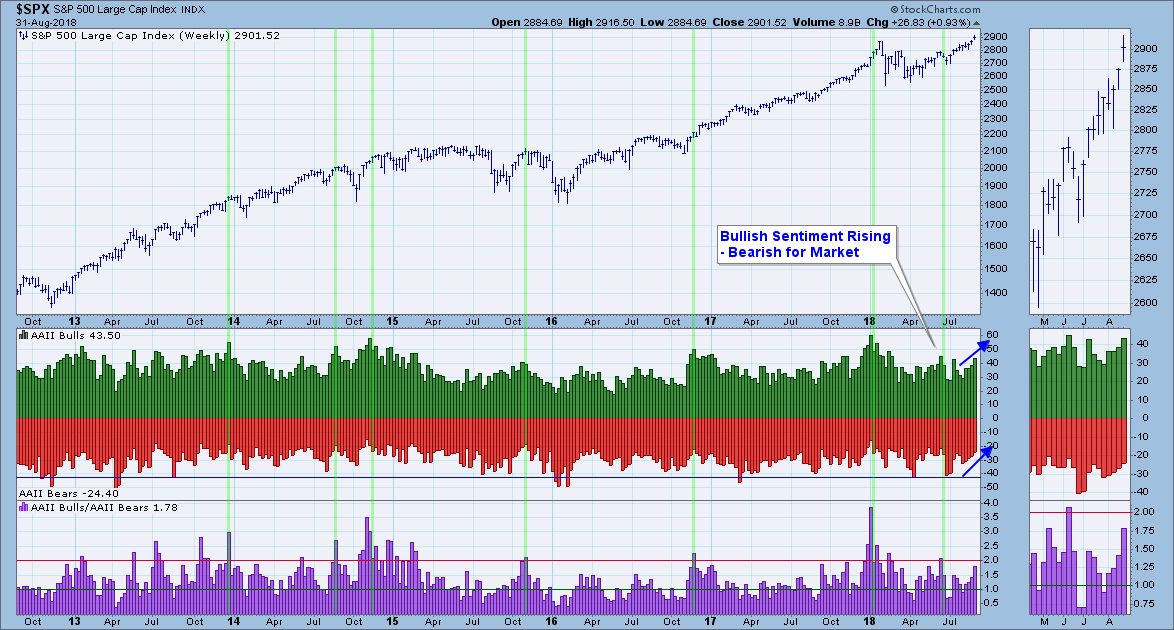
I also noted in today's sentiment update on MarketWatchers LIVE that both AAII and NAAIM are showing a high degree of bullishness. The American Association of Individual Investors (AAII) bull/bear ratio is near highs and you can see how the weekly numbers are consistently showing more bulls and less bears. We aren't at extremes yet, but it is high enough to suggest a possible reversal to the downside or at least consolidation of this week's move higher.
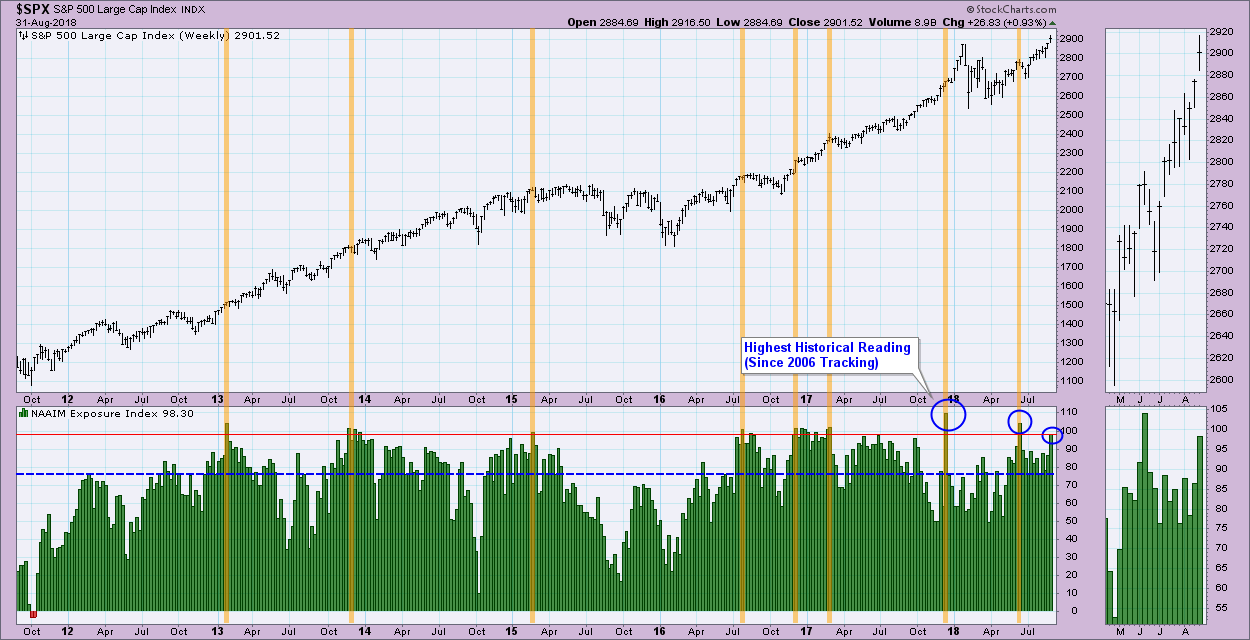
Finally the National Association of Active Investment Managers (NAAIM) shows that exposure is very high. This tells us that NAAIM participants are very exposed to the market and hence bullish.
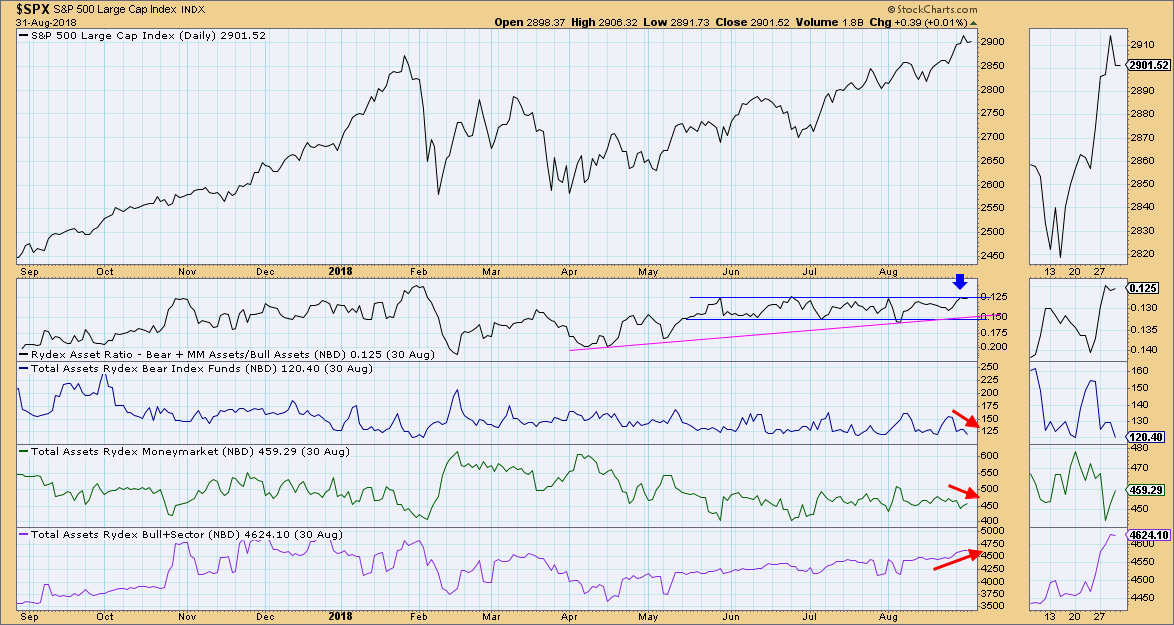
Last chart you should see is the Rydex Ratio chart. We can see that money is rotating away from bear and money market funds and into bull funds.
Conclusion: Shorter-term indicators are in decline and suggest weakness ahead for the market. That could come in the guise of consolidation or a pullback. Sentiment is getting very bullish and that suggests a downside reversal. With holiday trading added into the mix, I wouldn't expect to see a strong rally next week.
Technical Analysis is a windsock, not a crystal ball.
Happy Charting!
- Erin
Helpful DecisionPoint Links:
DecisionPoint Shared ChartList and DecisionPoint Chart Gallery
Price Momentum Oscillator (PMO)
Swenlin Trading Oscillators (STO-B and STO-V)
**Don't miss DecisionPoint Commentary! Add your email below to be notified of new updates"**


