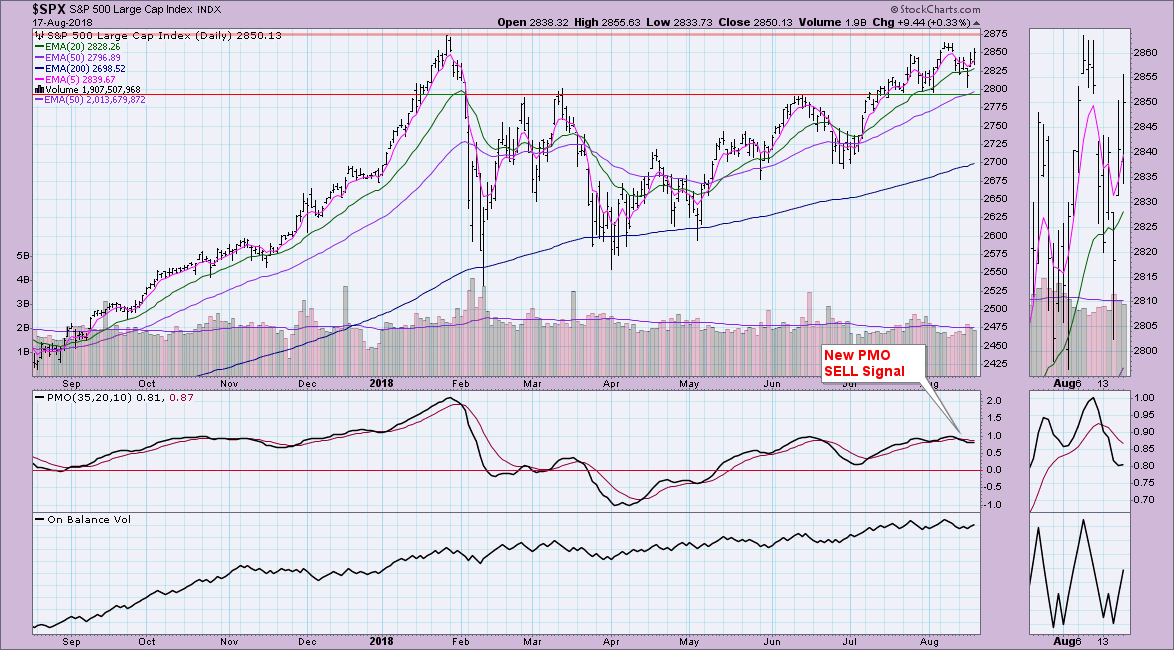
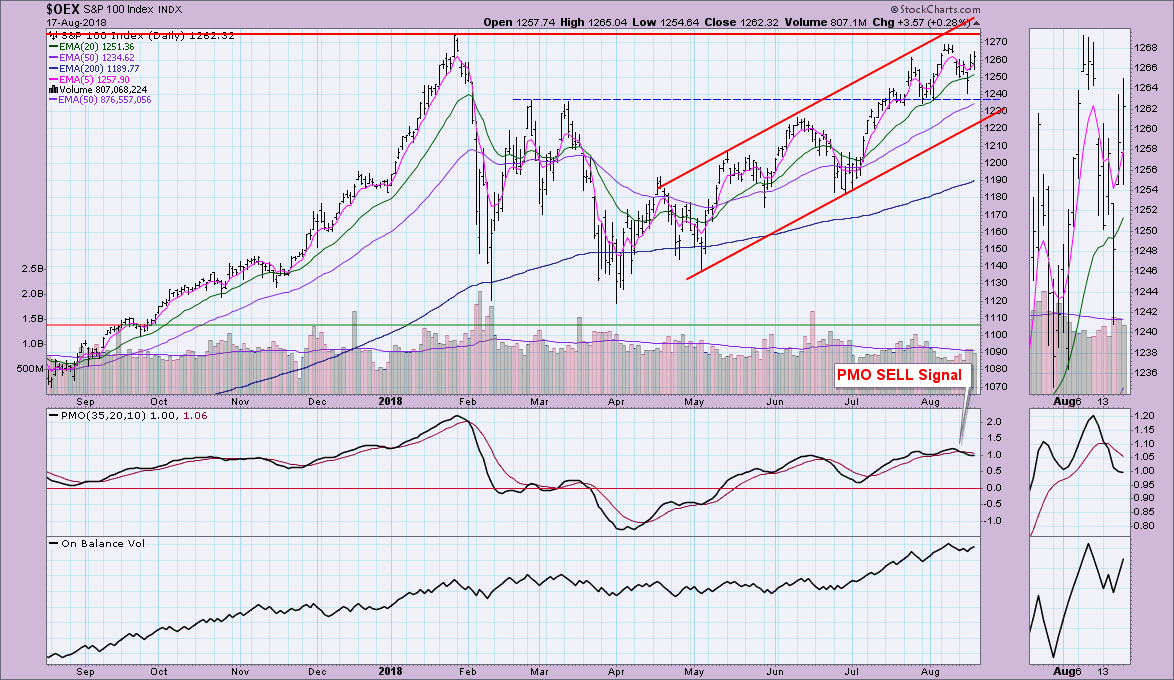
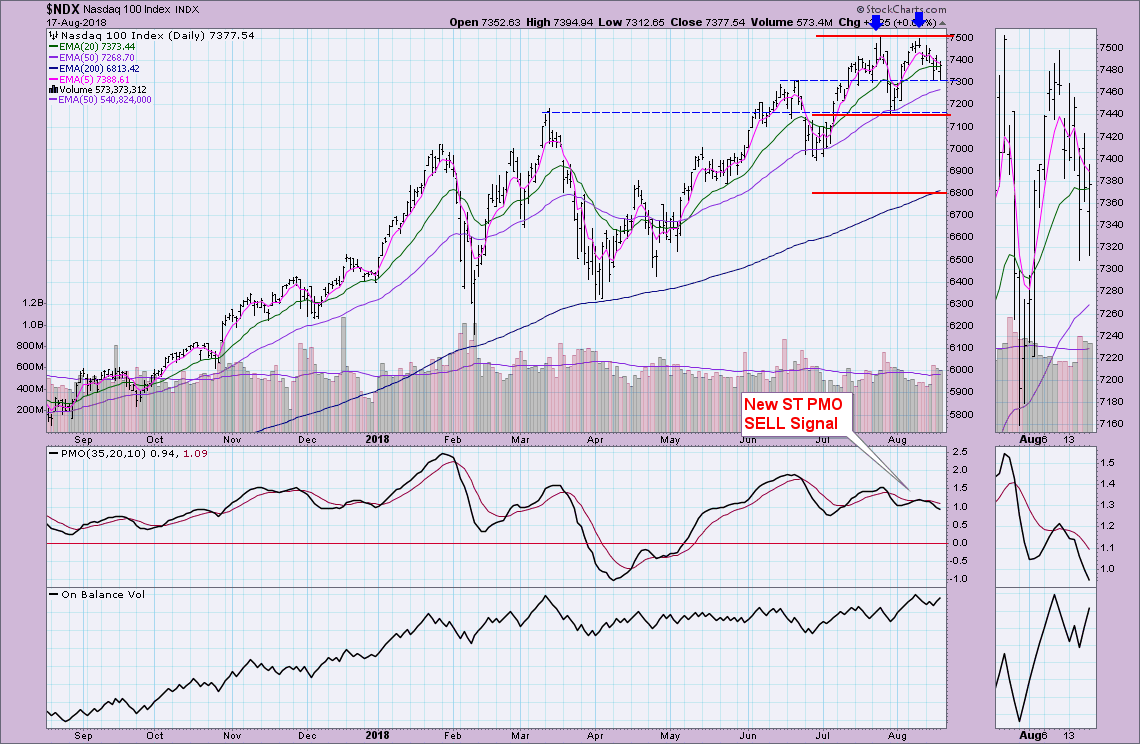
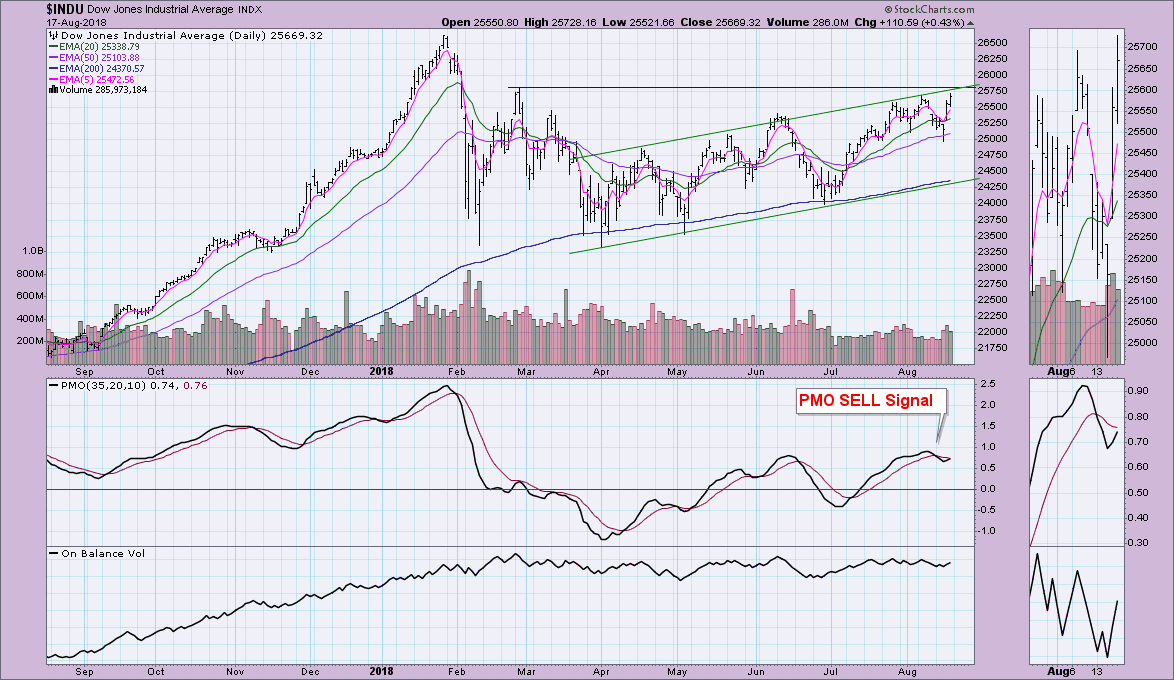
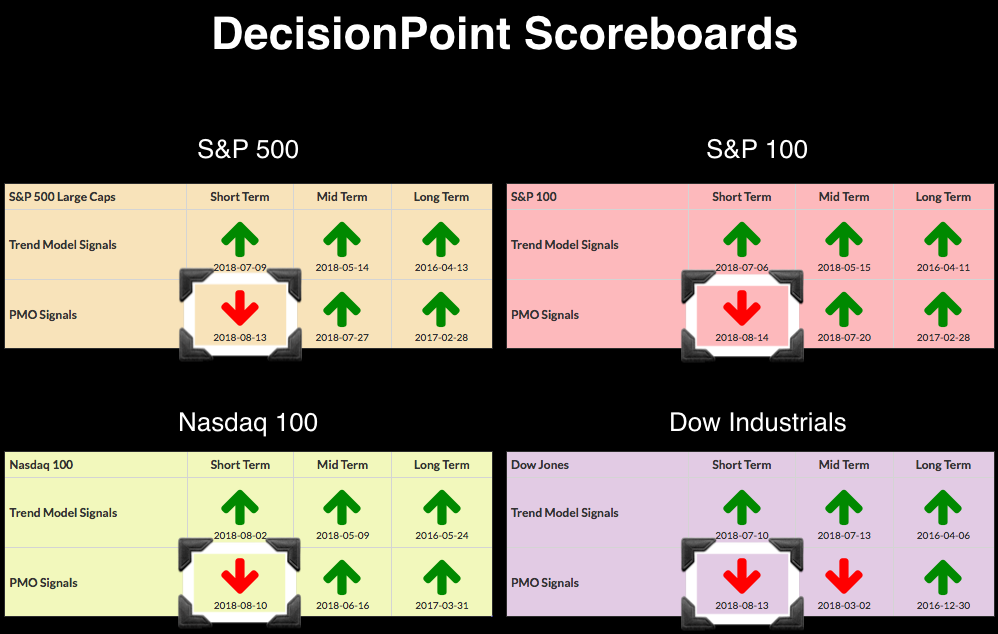
This week the market was rocking and rolling with large price swings. The DecisionPoint Scoreboards reflect new negative momentum for each of the indexes, but after logging those Price Momentum Oscillator (PMO) SELL signals, the market did an about-face and began to pull PMOs back up or slow their descent.
The SPX and OEX have similar features to their charts so I'll talk about them first. The first thing that I noted visually was the possible head and shoulders pattern that could be developing on both indexes. This is very early in the formation stage...the right shoulder hasn't really formed until Friday's intraday high becomes a short-term top and the neckline is actually penetrated. It still caught my eye and I wanted to note it as a possible short-term bearish set-up in the making.
Talking about bearish set-ups, the NDX is forming a near textbook double-top. We have the two tops, now we wait for the confirmation line to be broken at around 7150. Should this double-top execute, the minimum downside target would be 6800. Note the NDX's PMO hasn't really decelerated since its SELL signal.
The Dow has formed a volatile broadening pattern. These are typically bearish in nature and will resolve to the downside. Of all the indexes, the Dow's PMO is more robust. We could easily see a new PMO BUY signal logged on Monday for the Dow. My concern is the resistance forming at the top of the rising trend channel and the horizontal resistance line at the February top. The other Scoreboard indexes are showing weakness and the Dow's broadening pattern also could be a problem.
Conclusion: Momentum shifted lower this week and the NDX appears the most hurt. It's PMO is not back to rising or even decelerating. I noted that we had a DP Long-Term Trend Model BUY signal come in on Friday for the Consumer Staples ETF (XLP). Seeing the tech and financial stocks on the NDX weighing it down and a new strengthening in the defensive Staples sector, I would tell my intermediate-term investors to evaluate their positions and err on the side of caution.
Technical Analysis is a windsock, not a crystal ball.
Happy Charting!
- Erin
Helpful DecisionPoint Links:
DecisionPoint Shared ChartList and DecisionPoint Chart Gallery
Price Momentum Oscillator (PMO)
Swenlin Trading Oscillators (STO-B and STO-V)
**Don't miss DecisionPoint Commentary! Add your email below to be notified of new updates"**

