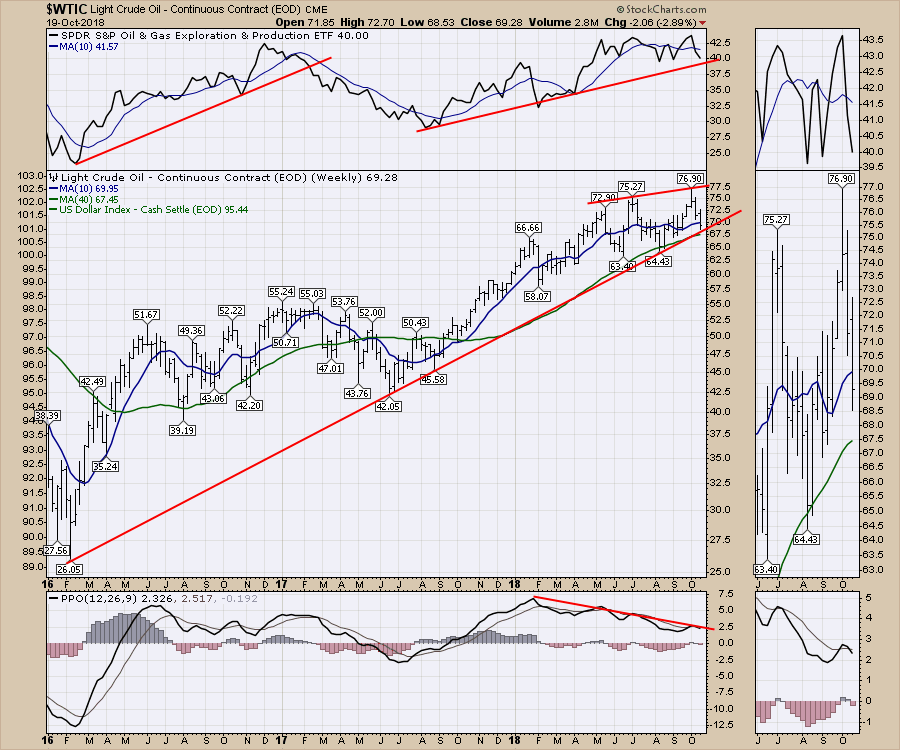
The setting couldn't be more climactic. Oil, seems to be generating attention from the world through Saudi Arabia, Iran, Russia, pipelines, global slowdown, trade pressures with China, EU issues in Germany and Italy, Brexit, Steel tariffs and the list goes on. The world's awareness is always high. This week, the chart arrives at a critical point again.
Oil closed the week testing the 3 year uptrend line off the 2016 low. Both the Exploration and Production ETF (XOP) as well as crude oil closed below the 10 week moving average. But more importantly, as oil has gone higher, the momentum has been slowing, shown on the PPO. Notice in the zoom panel that the PPO momentum indicator flipped to a sell signal again. Ignore the news. Watch the price action for investing in the energy sector.
 The refiners have been outperforming as the refining margin has increased over the last few months. The CRAK ETF for refiners suggests that is coming to an end after breaking a two year uptrend and the XLE sector ETF suggests weakness as well. Using weekly closes rather than intra-week lows, this is the first week where the ETF closed below the 18 month trend line. I extended the trend line back and it meets up with the absolute low in 2016 but not the weekly close for that week.
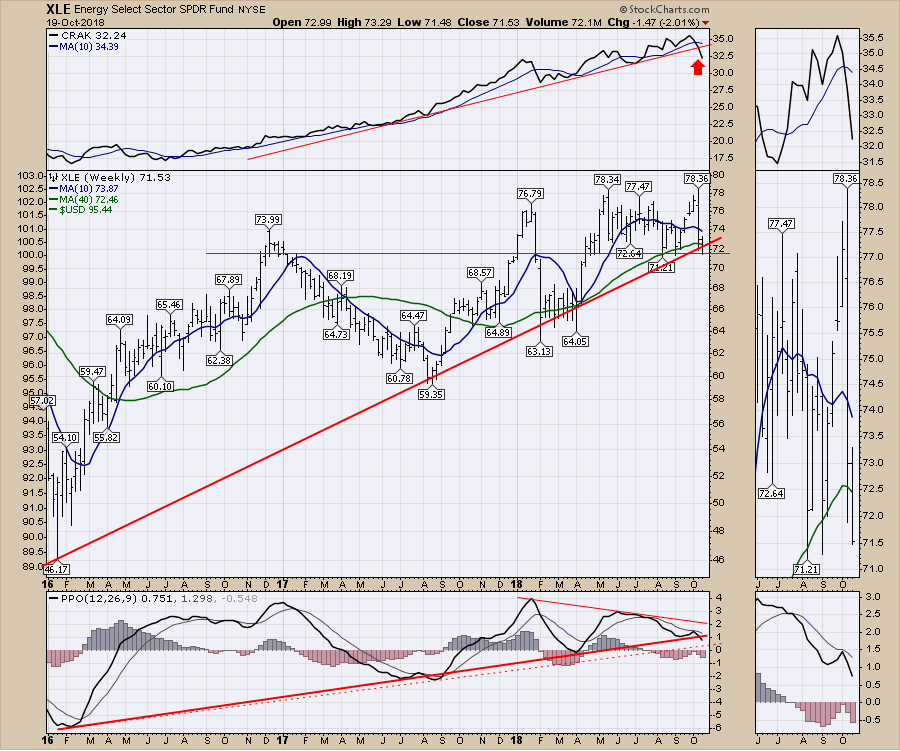 Staying with the chart above, I would suggest the up move in Energy is over as the PPO is also breaking down. There are lots of variables coming with Iranian sanctions November 1 as an example. But the second lower high on the PPO and the break of the uptrend on the PPO suggests caution is warranted. With all of these charts and indicators cracking, its important to remember commodity related stocks move fast both ways!
The bottom line, don't go surging into energy related stocks here unless you have tight stops below.
Bottom line = Protect your Energy related portfolio until the charts improve.
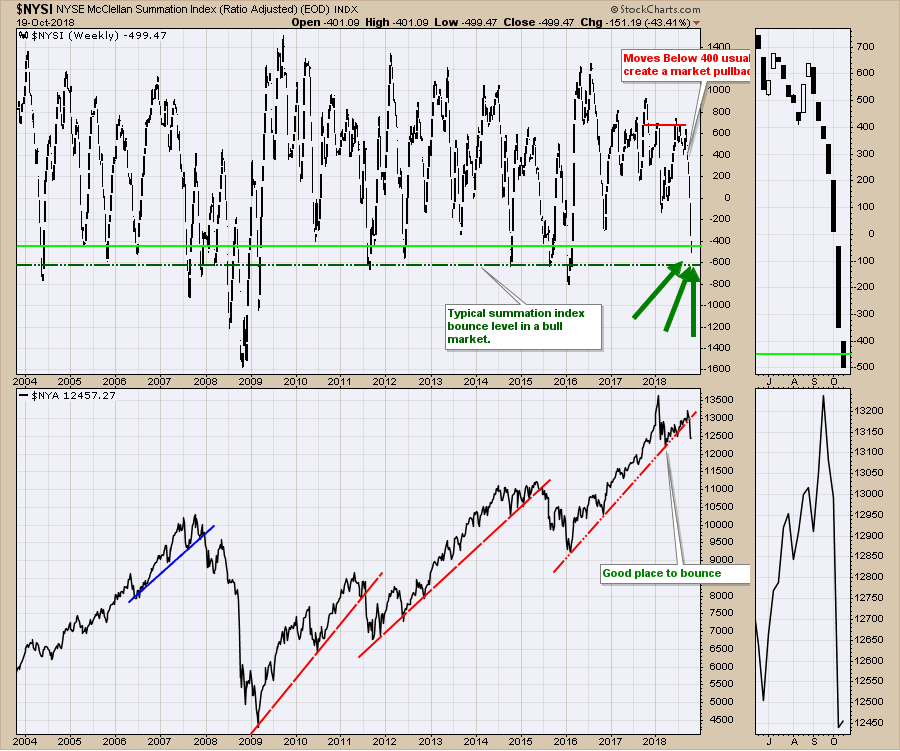
Lastly, it might be time to start looking for some short term bounce stocks here. Both the NYSE and the NASDAQ summation indexes are getting near levels that usually mark annual lows. If we are heading into the bear market these bounces will be short, fast and convincing that the bull is alive and well. But the moves can be swift enough to make a years returns in a few weeks.
 I will be describing these setups on this weekends edition of the Commodities Countdown video. Lots of indicators are stretched to the downside. Check the StockCharts Youtube channel or my Canadian Technician blog where all my work is posted. Below is the October 13th Commodity Countdown Video.
If you haven't seen my article on Is A Major Top In Place? I would encourage you to look through the article and decide if the charts provide enough evidence for you to consider the possibility.
I would encourage you to watch the three videos below this week to see if you agree. We can choose to differ, I would just like more facts suggesting why I am wrong.
The Canadian Technician video shows the massive breakdown on almost every sector chart in Canada. This week the Canadian market started what appears to be a major breakdown. Financials also fell outside their channel and below the 40 WMA. For Canadian investors, huge caution here.
Gold is perking up, a few of the agriculture commodities are perking up and Natural Gas has been behaving well. However, the stocks around those areas are still struggling with the overall market sentiment. Lots of information in here on the indexes, currencies, bonds and commodities.
This is a short look at the broad market setup and some of the indicators that told us the market was fragile ahead of the drop.
If you are missing intermarket signals in the market, follow me on Twitter and check out my Vimeo Channel often. Bookmark it for easy access!
Good trading,
Greg Schnell, CMT, MFTA
Senior Technical Analyst, StockCharts.com
Author, Stock Charts for Dummies
Want to read more from Greg? Be sure to follow his StockCharts blog:
The Canadian Technician


