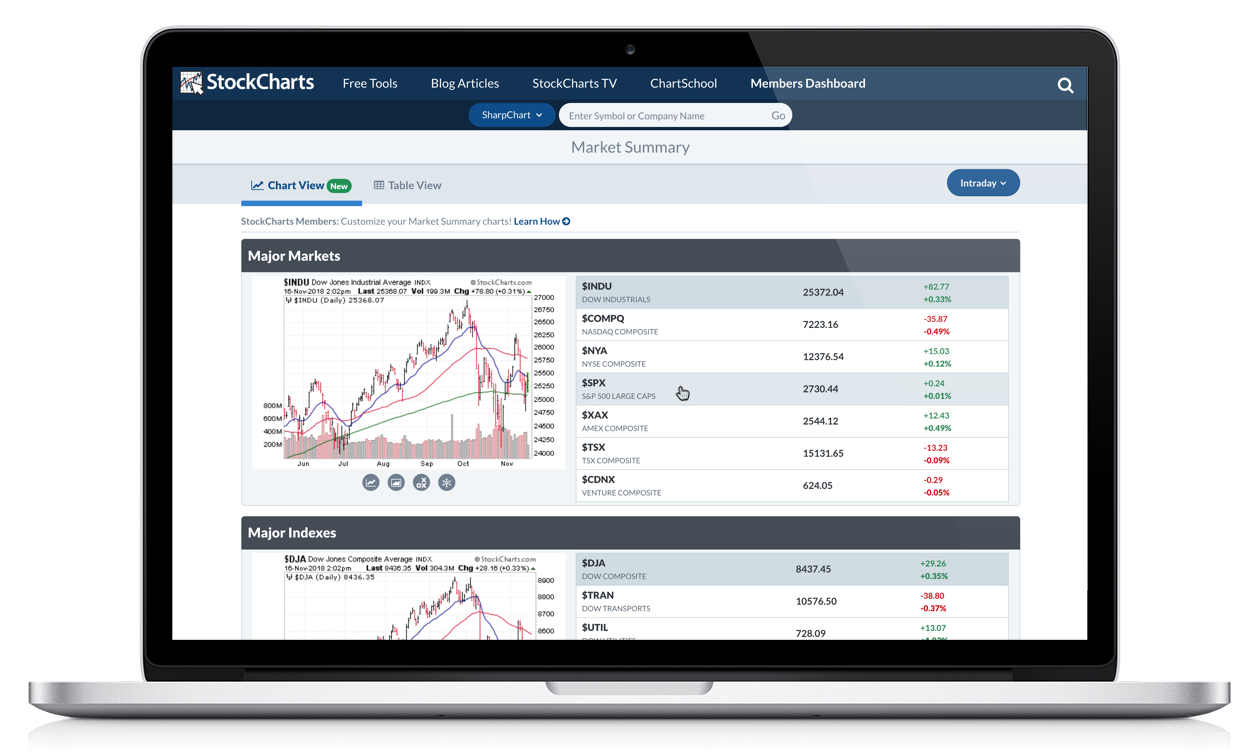
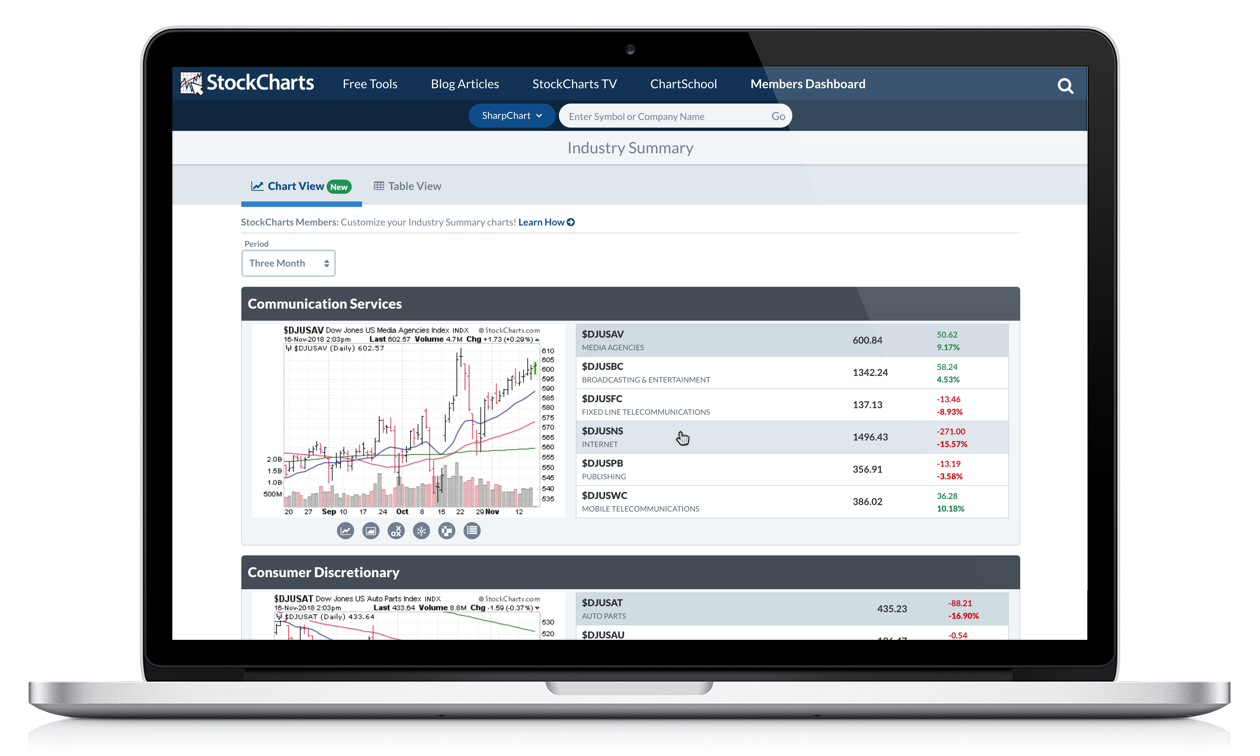
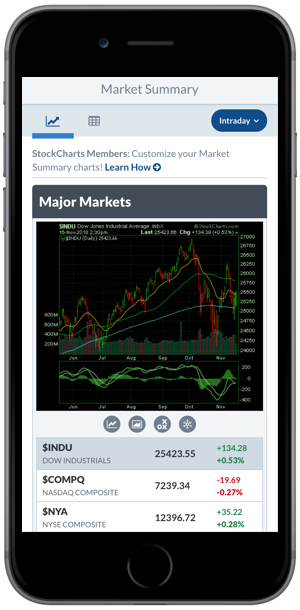
The more charts, the better. That's my motto, especially this week. I'm happy to announce that our Market Summary and Industry Summary pages have recently received a major upgrade – "Chart View" is here! We've expanded the functionality of these two important pages, making them even more useful resources to help you track and analyze the current markets.

Market Summary Page
On our new-and-improved Market Summary page, you'll now see two tabs at the top – one for the original "Table View" and a new tab for "Chart View." This new view brings larger price charts to the page, allowing for more detailed study of these market indexes and important ETFs and how they're trading.
By default, the first index in each table will be selected and charted. To change the selection, click on each row in the tables to see the chart for that index or ETF. You can also use the grey buttons below each chart to view the selected symbol in other modes, including a full-size SharpChart, P&F chart or Seasonality chart.

Industry Summary Page
Similar to our Market Summary page, the Industry Summary now includes the "Chart View" feature. The important difference here is that the Industry Summary allows you to see multiple data periods – intraday, end-of-day, one month, six months, year-to-date, one year, etc.
When you change the period at the top of the page, you'll notice that both the data in each table and the charts themselves are updated to reflect that new period. Personally, I love how this feature allows you to start with the longer-term one-year view and "zoom in" to what's happening right now on the intraday charts.
MEMBERS: Customize Your "Chart View"
 As a StockCharts Member, you can customize the charts you see on both the Market Summary and Industry Summary pages. This is very similar to the customizations you can make on your CandleGlance and GalleryView charts. If you want to change the chart type, period or color scheme, or add some different indicators to your "Chart View" charts, it's quick and easy to do so!
All you need to do is create a new ChartStyle from the SharpCharts Workbench and save it with the name "Market Summary" (for use on the Market Summary page) or "Industry Summary" (for use on the Industry Summary page). The settings and indicators you save for those custom ChartStyles will automatically appear when you visit these pages.
Important Tip: select a width of 460 when you create your custom "Market Summary" or "Industry Summary" ChartStyles. This will optimize the sizing of your custom charts on these pages.
For complete instructions on how to create and save a new ChartStyle, click here. You can also learn more about all of our tool-specific ChartStyles here.
As you can imagine, people often ask, "Why should I subscribe to StockCharts?" It's easy for us to point to the expanded set of features that you gain access to as a member – larger charts, more indicators and overlays, technical scans, custom alerts and much more. For me, though, one of the best reasons to subscribe is that you gain the ability to make a wide array of site customizations and special settings changes.
Setting up your StockCharts experience to better fit your needs, preferences and overall investing workflow not only makes the site more powerful for you, but also more enjoyable. Think of it this way – you could grab some generic pants off the rack and they'd probably fit alright. But wearing a perfectly tailored pair of slacks that have been custom-fitted to your specific measurements? Now that is comfort.
To sign up for a free 1-month trial and explore all of the tools and features that StockCharts Membership includes, click here!
Until next time,
Grayson Roze
Business Manager, StockCharts.com
Author, Trading For Dummies


