Editor's Note: This article was originally published in John Murphy's Market Message on Friday, November 30th at 2:36pm ET.
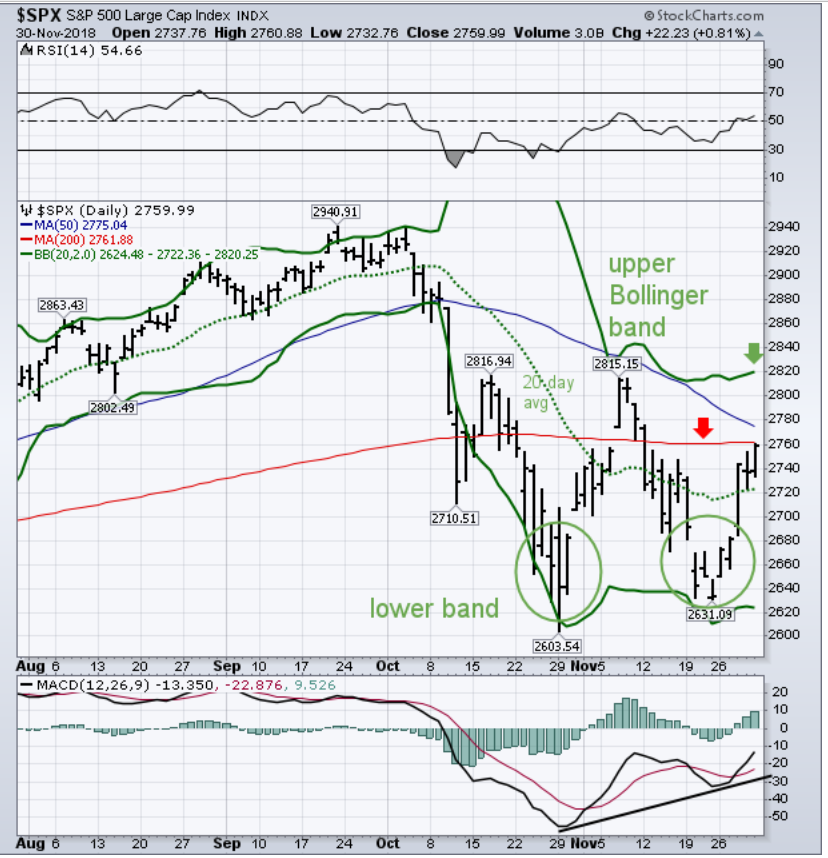
There are lots of way to determine the trend of the stock market. The placement of moving average lines is one of them. Bollinger bands (invented by John Bollinger) are another. Chart 1 applies both techniques to a daily chart of the S&P 500. The chart shows the SPX bouncing off previous support at its late October low which is positive short-term development. And it's now moving up to test its 200- and 50- day moving averages (red and blue lines). The 14-day RSI line (upper box) and daily MACD lines (lower box) are also improving. The two solid green lines overlaid on Chart 1 are Bollinger bands. The middle dashed line is the 20-day moving average, which is used to measure short-term trends. The two outer Bollinger bands are plotted two standard deviations above and below that middle line. Those two outer bands can act as support and resistance levels. A price drop below the 20-day line often signals short-term weakness, as it did at the start of October. The chart, however, shows the last two recent price bottoms finding support at the lower band (green circles). The SPX has now moved back over the middle 20-day line which reflects short-term strength. And it shows also shows the upper band coinciding roughly with its early November peak at 2815, which represents an important resistance level. Weekly Bollinger bands are also providing support.
Chart 1


