 The Momentum Factor iShares (MTUM) and the Minimum Volatility iShares (USMV) represent opposing sides of the market. High flying stocks can be found in the momentum ETF, while the more boring issues dominate the minimum volatility ETF.
Using these two ETFs, chartists can quickly take the temperature of the stock market and adjust their strategy. The market is running hot and then risk appetite is strong when momentum stocks outperform (risk on). Conversely, the market is running cold and the risk appetite is weak when low volatility stocks outperform momentum stocks (risk off).
The chart below shows MTUM in the top window and USMV in the second window. There are around 124 stocks in MTUM with the technology sector accounting for 41.3% of the ETF. Also note that the top ten stocks account for 43.6%, which makes this a top-heavy ETF.
In contrast to MTUM, there are over 200 stocks in UMSV with technology accounting for 20%. However, healthcare (15.5%) and consumer staples (11.5%) are also well represented. In addition, the top ten stocks account for around 14.5% of USMV and the components are more evenly distributed.
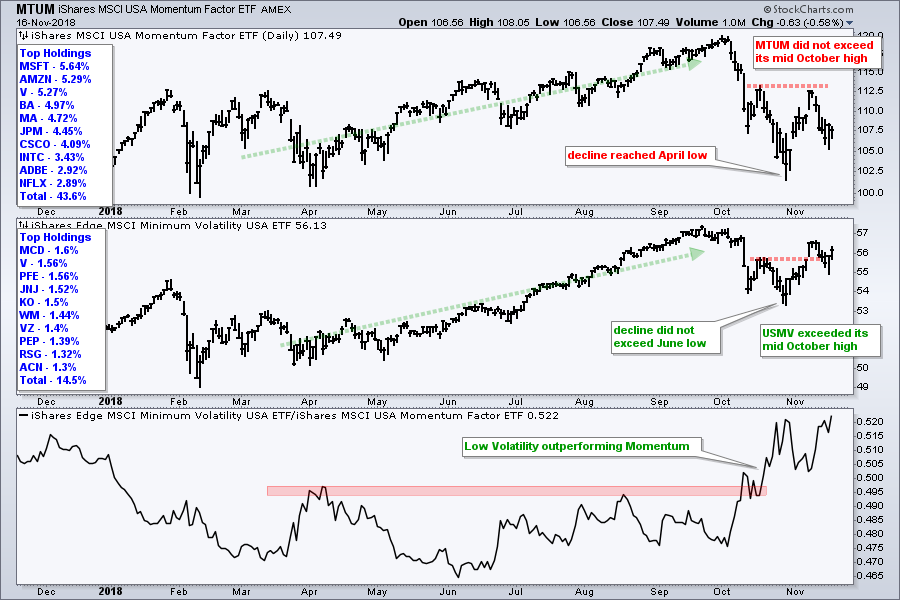
USMV is outperforming USMV on the price charts. MTUM fell much harder than USMV in October. MTUM fell to its April lows, while USMV held above its June low. The November bounce in USMV was also stronger because the ETF exceeded its mid October high. MTUM did not exceed its mid October high.
Preference for Minimum Volatility is also reflected in the USMV:MTUM ratio in the lower window. This ratio broke out in October and hit a new high on Friday. This means the Minimum Volatility ETF is outperforming the Momentum ETF.
On Trend on Youtube
Available to everyone, On Trend with Arthur Hill airs Tuesdays at 10:30AM ET on StockCharts TV and repeats throughout the week at the same time. Each show is then archived on our Youtube channel.
Topics for Tuesday, November 12-13:
- Big Advances and Big Ranges.
- Failing in Key Retracement Zones.
- Appetite for Risk Remains Low.
- Charting Weekly Breadth Indicators.
- What's Up (Down) with the Big Banks.
- Bloomberg Commodity Indexes.
- Click here to Watch
Plan Your Trade and Trade Your Plan.
- Arthur Hill, CMT
Senior Technical Analyst, StockCharts.com
Book: Define the Trend and Trade the Trend
Twitter: Follow @ArthurHill


