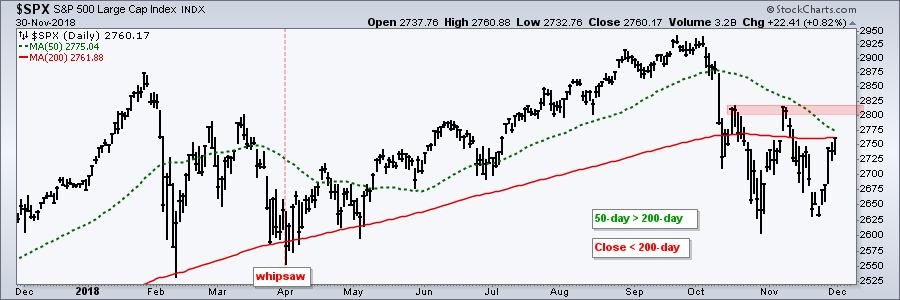
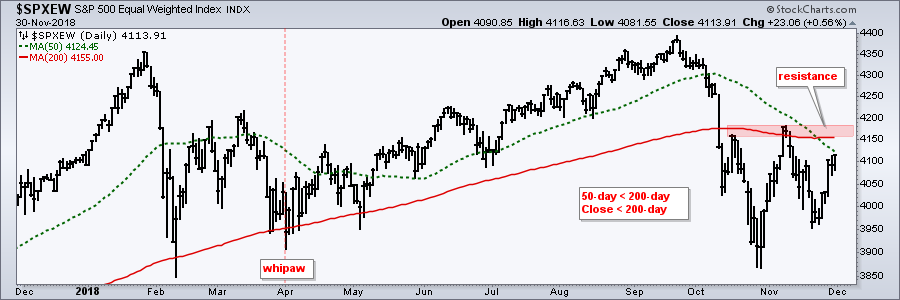
 The S&P 500 is the most widely used benchmark for U.S. stocks and the 200-day SMA is the most widely used moving average. Together, chartists can use the S&P 500 and the 200-day SMA to determine the broad trend for the stock market.
The S&P 500, however, does not tell the entire story. Note that the top 50 stocks (10% of the total) account for 50% of the index weightings. Chartists interested in the other 450 stocks can consider using the S&P 500 Equal-Weight Index ($SPXEW) to confirm signals in its big brother. As its name suggests, the S&P 500 Equal-Weight Index applies the same weight to each stock in the index. Admittedly, the weights are not "exactly" equal, but they are more evenly distributed and this index reflects performance for the "average" stock in the S&P 500.
The first chart shows the S&P 500 trading right below the 200-day SMA and around 2% below resistance from the prior peaks (red resistance zone). The 50-day SMA is above the 200-day SMA, but the 50-day is closing in fast on the 200-day. At this point the index needs to break above the red resistance zone for the bulls to retake control of the trend.
The next chart shows the S&P 500 Equal-Weight Index trading below the 200-day SMA. In addition, the 50-day SMA sliced through the 200-day SMA. The red resistance zone marks resistance from the prior peaks. The index needs to break above this zone for the bulls to retake control of the trend. Using the principle of confirmation, I would require breakouts in both the S&P 500 and the S&P 500 Equal-weight Index.
On Trend on Youtube
Available to everyone, On Trend with Arthur Hill airs Tuesdays at 10:30AM ET on StockCharts TV and repeats throughout the week at the same time. Each show is then archived on our Youtube channel.
Topics for Tuesday, November 27th:
- Broad Market Overview - 50-days Closing Fast
- Big Sectors Continue to Weigh - Defensives Hold Up
- Bounces within Bigger Downtrends (KRE, IBB, ITB...)
- Focus on Semiconductor ETFs and Stocks
- Stock to Watch (AMGN, ANTM, LLY, MRK, PFE...)
- Click here to Watch
Plan Your Trade and Trade Your Plan.
- Arthur Hill, CMT
Senior Technical Analyst, StockCharts.com
Book: Define the Trend and Trade the Trend
Twitter: Follow @ArthurHill


