The Price Momentum Oscillator (PMO) is a great measure of acceleration/deceleration of price for individual entities. Combining each component's PMO readings within an index is especially advantageous in allowing us to understand how overbought or oversold it is in three timeframes. Although readings are oversold, they are still declining. This suggests that prices within the SPX, OEX and NDX are vulnerable to more downside price action.
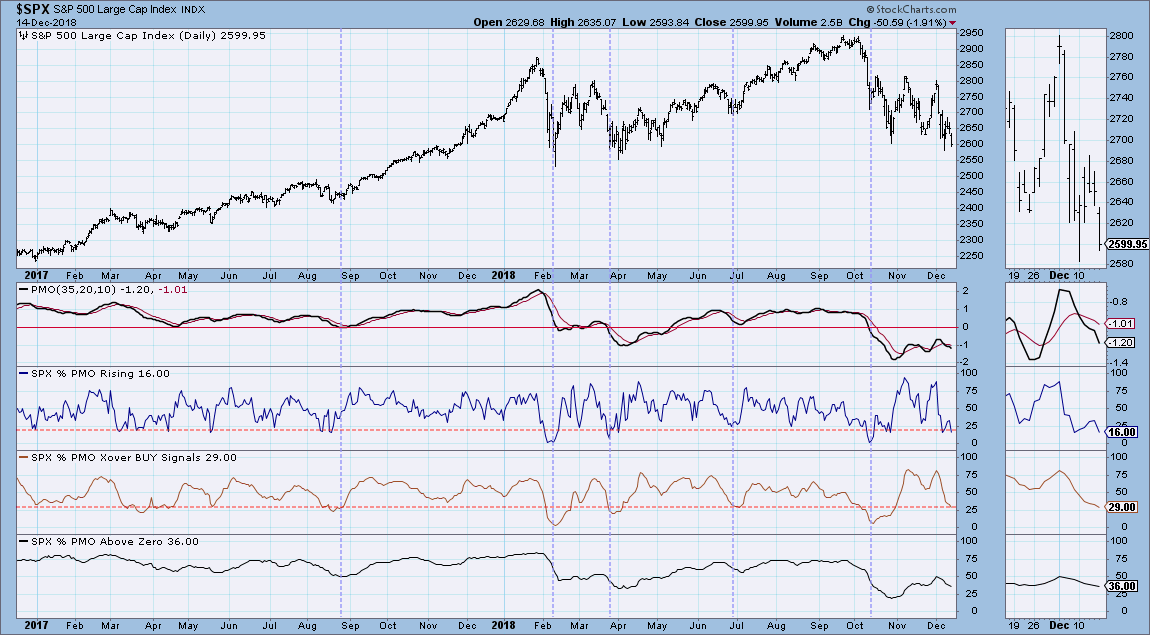
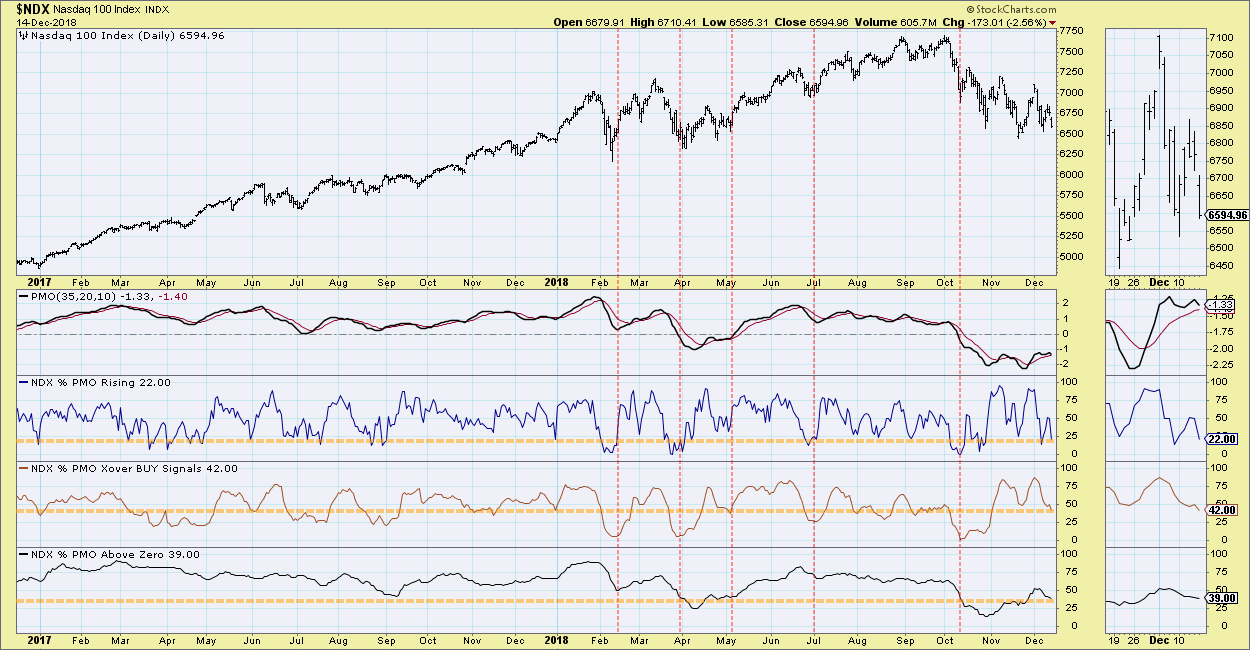
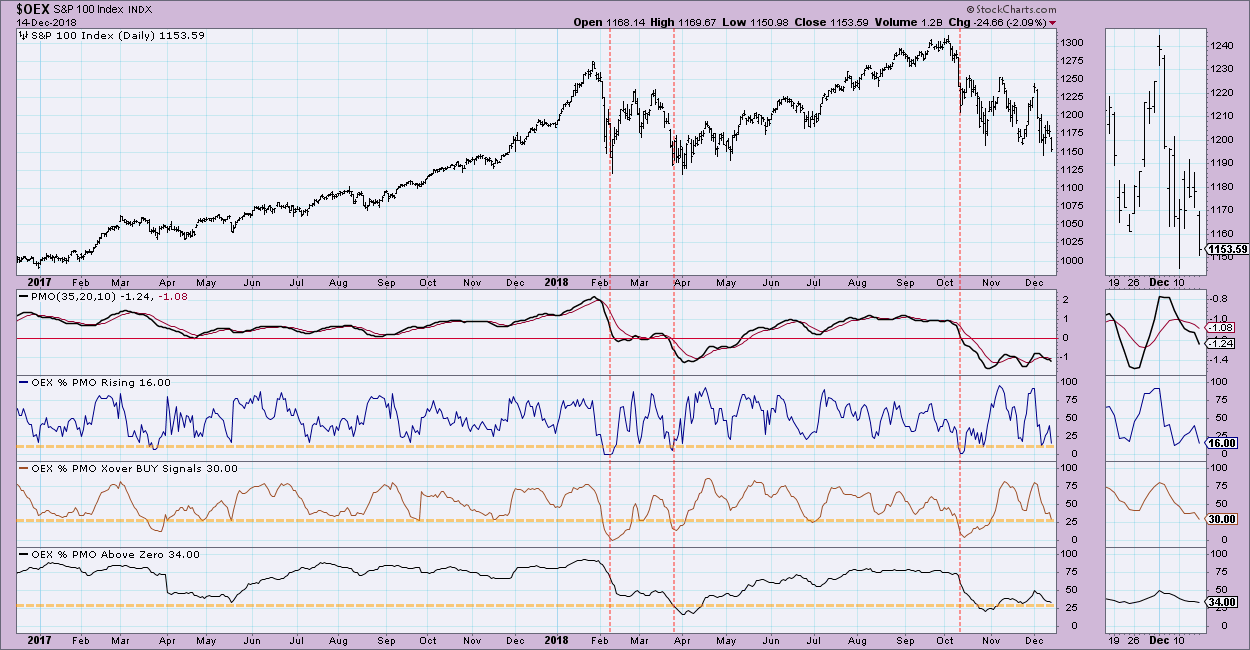
Let's review each of the panes below price. The first is the short-term indicator, which measures whether a PMO is rising. For reference, you can look at the index's PMO to visualize. Below it, the intermediate-term indicator measures how many index components are on PMO BUY signals, meaning the PMO is above its signal line. Finally, the long-term indicator measures whether the PMO reading is above or below the zero line.
On the SPX PMO Analysis chart, note that while the short-term indicator is quite oversold already, it can still move further into oversold territory. The same goes for the long-term component. The IT indicator window is oversold as well, but it can certainly continue lower into more oversold extremes. Ultimately, the problem is that all three are declining. We need to see a bottom on at least some of the indicators in order to fuel a rally.
 The NDX shows nearly the same picture, except that I noted a steep downside acceleration in the thumbnail for the % PMO Crossover BUY Signals. Indicators are oversold, but not at extremes.
 The last PMO Analysis chart is for the OEX. Like the NDX, we are seeing acceleration to the downside on % PMO Crossover BUY Signals.
 Conclusion: PMO analysis shows that while readings are oversold, they can certainly get further oversold. We can see this in action right now as current readings are continuing to decline. Typically, we don't see a rally until at least one of these indicators bottoms. If you'd like to have a copy of your own PMO Analysis charts, download the "DecisionPoint Market Indicators" ChartPack. It's free to Extra members and above! Just go to "Your Account" in the upper right-hand corner and click on "Manage ChartPacks."
Technical Analysis is a windsock, not a crystal ball.
Happy Charting!
- Erin
Helpful DecisionPoint Links:
DecisionPoint Shared ChartList and DecisionPoint Chart Gallery
Price Momentum Oscillator (PMO)
Swenlin Trading Oscillators (STO-B and STO-V)
**Don't miss DecisionPoint Commentary! Add your email below to be notified of new updates"**


