It looks like another tough month for the markets as year-end approaches. The index swings are getting increasingly aggressive and it feels like nearly every sector is getting yanked around. While there are lots of reasons to be bullish based on some of the "oversold" sentiment indicators, other reasons suggest a more worrisome stance.
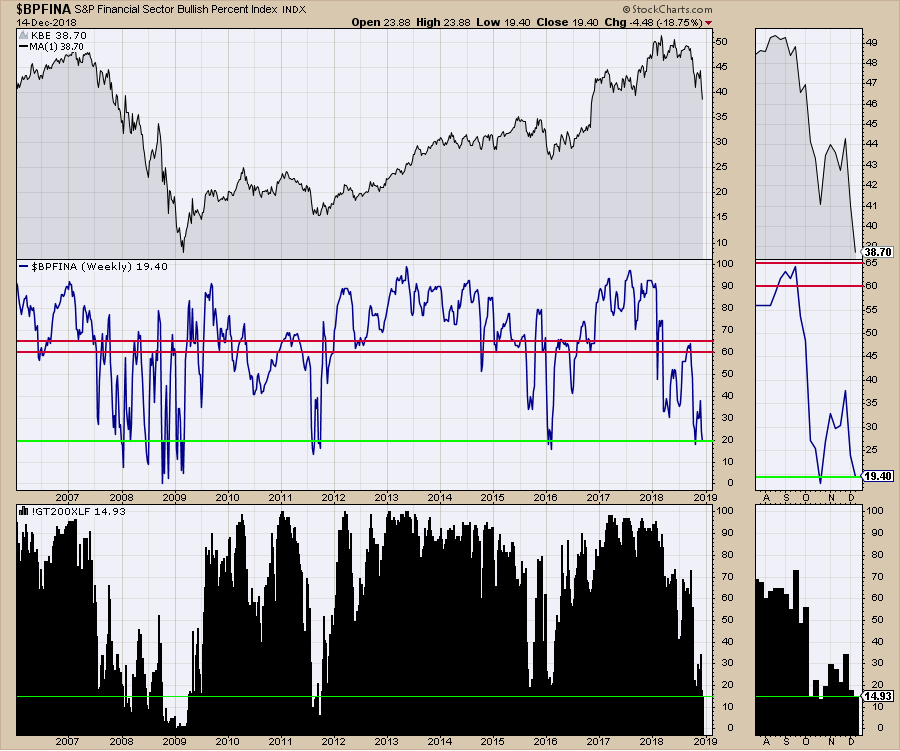
In the chart below, the top panel shows the KBE Bank ETF, which has sold off by 25%. The dip isn't quite as big (in percentage terms) as the big dips of 2011 (42%) and 2016 (28%) were.
Looking at the Financials Bullish Percent Index in the center panel, we can see that we are down near some of the big retracement levels. 2008 and 2016 reached these low levels close to the start of the new year.
The percentage of stocks above the 200-day moving average is shown in black on the bottom panel. When the market gets this weak, it typically needs more time to correct.
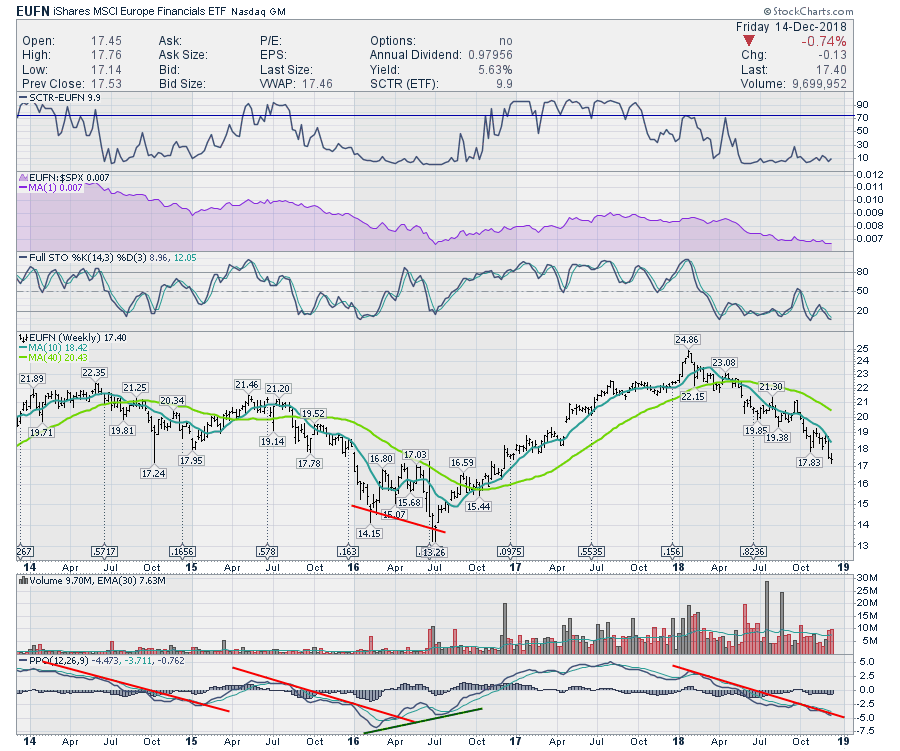
 Currently, one of the big problems is that the global banking charts look terrible. As one of the New York-based technicians said, when the banking charts go bearish, that is when there are problems. The reason is that the bankers can see everyone else's books. The chart below shows the European Financials ETF. Even though there is no divergence on the chart yet, the ETF is off 30% from its highs.
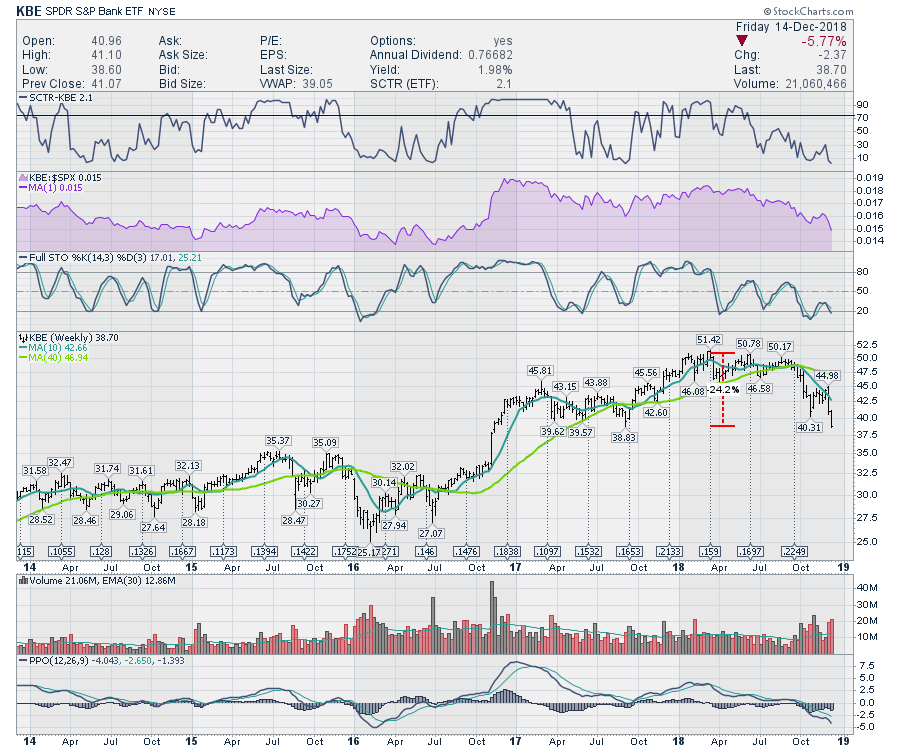
 The US Bank charts have plummeted in the last 9 trading days. The KBE Bank ETF has sold off 13% in two weeks and is 24% off the high. Ouch!
 While the Fed has been raising rates, these US banks were coping in the first half of the year. However, this has clearly changed after the June highs, which was when the banks diverged from the $SPX. The Fed meeting on Wednesday, however, could cause a change in sentiment. The next 10 days will need a rally to turn the $SPX positive for the year.
This Final Bar video shows some concerning charts. However, getting ready for the next rally is key.
I have been discussing the gold setup for weeks now, but the breakout seems to just be getting started. In the video, I work through gold and would encourage you to view this setup in detail. With the US Dollar pushing higher again this week, the gold-related trade has slowed.
For those of you who are looking for a small gift, you might have family or friends that would like to learn more about the basics of charting; if so, they'll love Stock Charts for Dummies. The first section of the book walks through all the chart settings to get the charts you want, the second section explores why you might use charts for investing and the third section is about putting it all together.
Click here to buy your copy of Stock Charts For Dummies today!
If you are missing intermarket signals in the market, follow me on Twitter and check out my Vimeo Channel. Bookmark it for easy access!
Good trading,
Greg Schnell, CMT, MFTA
Senior Technical Analyst, StockCharts.com
Author, Stock Charts for Dummies
Hey, have you followed me on Twitter? Click the bird in the box below!
Want to read more from Greg? Be sure to follow his StockCharts blog:
The Canadian Technician


