 As obvious as it seems, lower lows and lower highs are the order of the day in a downtrend. Thus, prices are expected to break prior lows and continue lower when the trend is down. Taking this downtrend concept one step further, one could also assume that support levels within downtrends are highly questionable and offer false hope. After all, lower lows are the norm, not the exception.
Our first job as chartists is to identify the bigger trend at work. Once trend direction is established, we can then direct our focus and set our trading bias. I try to focus on resistance, bearish setups, and bearish patterns during a downtrend. By extension, I try to ignore dubious support levels, bullish setups, and bullish patterns. I am working under the assumption that the bigger downtrend is the dominant force at work. A downtrend environment favors bearish resolutions over bullish resolutions. Bearish patterns have a better chance at success than bullish patterns, while resistance levels have a better chance of holding than support levels. It is all about probabilities.
Invariably, there is always another support level below current prices and we could draw dubious support lines all day. Marking support levels in a downtrend is just creating more noise. The chart below shows the S&P 500 with at least nine possible support levels. As far as I am concerned, the trend reversed with the price breakdowns and bearish breadth signals in mid-October. Once the trend turned down, support levels based on prior lows became noise in my book.
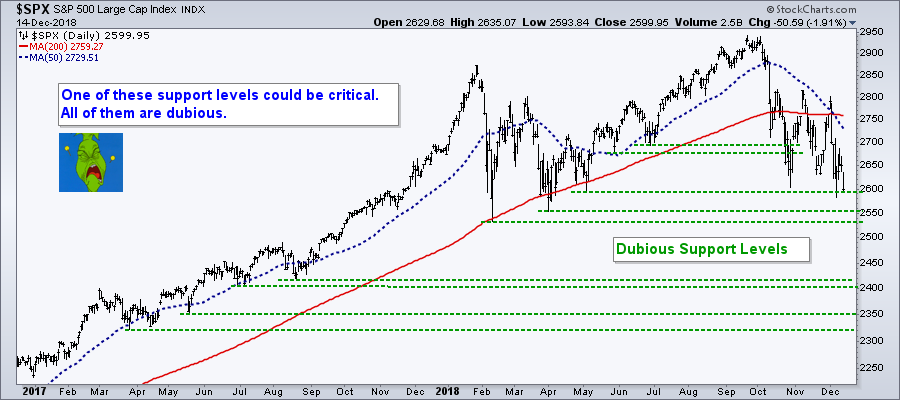
There is probably one "critical" support level in this bunch, but good luck picking the right one. The S&P 500 is clearly not "On Trend" and I will not be marking support levels until the index actually reverses its downtrend. In Dow Theory terms, the onus is on the bulls to prove the bears otherwise. Until then, I will respect the downtrend and be a good Grinch. Merry Christmas and Happy New Year!
On Trend on Youtube
Topics for Tuesday, December 11th:
- SPY, MDY and IJR Break Triangle Lines
- XLF, XLI and XLE Lead Sectors Lower
- Finance-related ETFs Weigh (KRE, IAI, KIE)
- Treasuries Remain Strong and Junk Weak
- Some Tech-related ETFs Hold Up, BUT....
- Stocks to Watch (AMZN, HRB, BIIB...)
- Click here to Watch
Topics for Thursday, December 13th:
- Weak Breadth on Reversal Attempt.
- Support is Suspect in a Downtrend ($SPX, $SPXEW).
- Bear Market Expectations Apply (Bullish Setups Don't Work).
- EW Sectors Reflect Broad Weakness.
- Stocks to Watch (CHRW, IBM, INTC, EL, FLS...).
- Click here to Watch
- Arthur Hill, CMT
Senior Technical Analyst, StockCharts.com
Book: Define the Trend and Trade the Trend
Twitter: Follow @ArthurHill


