Editor's Note: This article was originally published in John Murphy's Market Message on Friday, December 14th at 2:32pm ET.
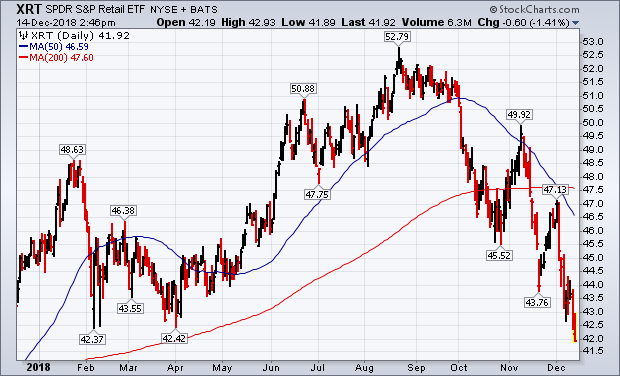
Two of the earliest warning signs since October that the stock market was in trouble was the fact that economically-sensitive stock groups like small caps and transports were leading the market lower. And they're doing that again today. Chart 4 shows the Russell 2000 Small Cap Index undercutting its February intra-day low today to put it at a new 52-week low. Chart 5 shows the Dow Transports doing the same. Weakness in those two groups is a negative warning sign for the market and the U.S. economy. So is the drop in our last chart. Chart 6 shows the S&P Retail SPDR (XRT) also falling to a new 52-week low. And that's happening during the Christmas shopping season which is supposed to be the best time of the year for retailers. It seems clear from the heavy selling in those three groups, and the rest of the market, that investors are bracing for bad economic news in the new year. And they're not waiting around to hear that news. That's why stocks usually peak before the economy. And why we can't use old economic data to predict the direction of the economy or the stock market.
Chart 4
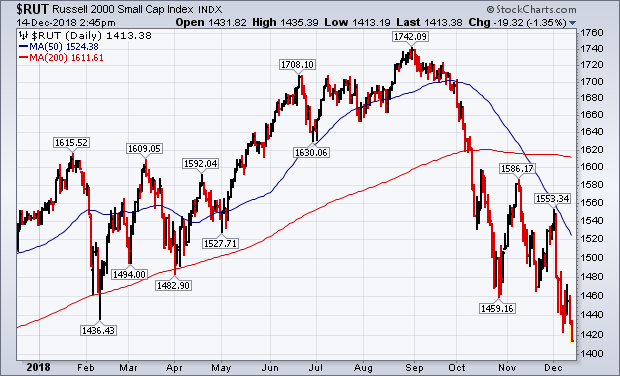
Chart 5
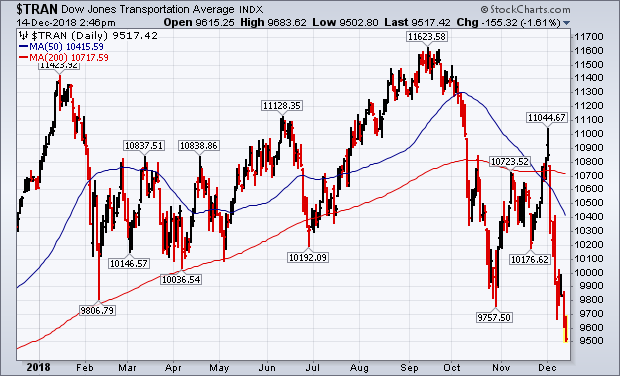
Chart 6