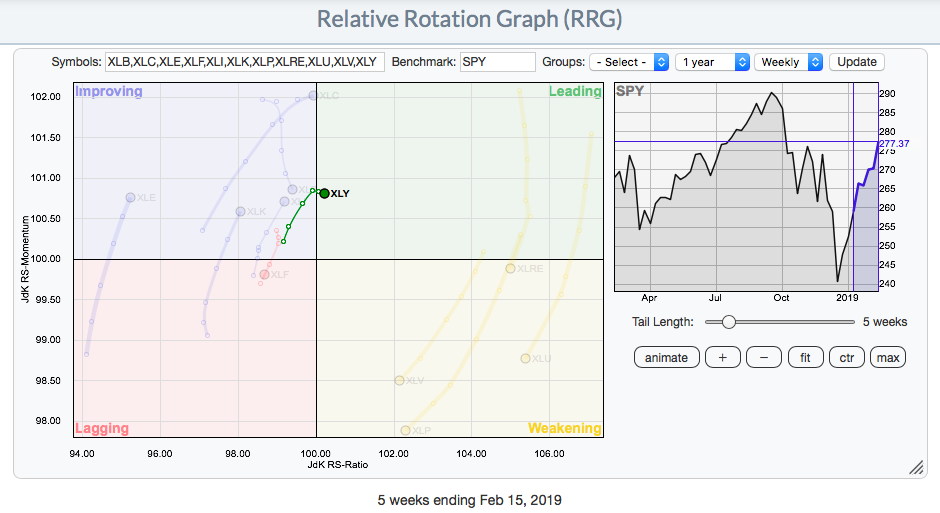
Understanding relative strength is extremely important in outperforming the benchmark S&P 500. As a sector begins to outperform, it tells us that money is rotating towards that particular sector. One way to visualize this is to look at an RRG chart. It will only take one glance to quickly identify what's working RIGHT NOW and what is not:
 I have highlighted consumer discretionary (XLY) on this chart because it's the only sector with "RS-Momentum" and "RS-Ratio" above 100 readings. That places it in the leading quadrant and tells us that we need to beware of the money rotating into consumer discretionary stocks.
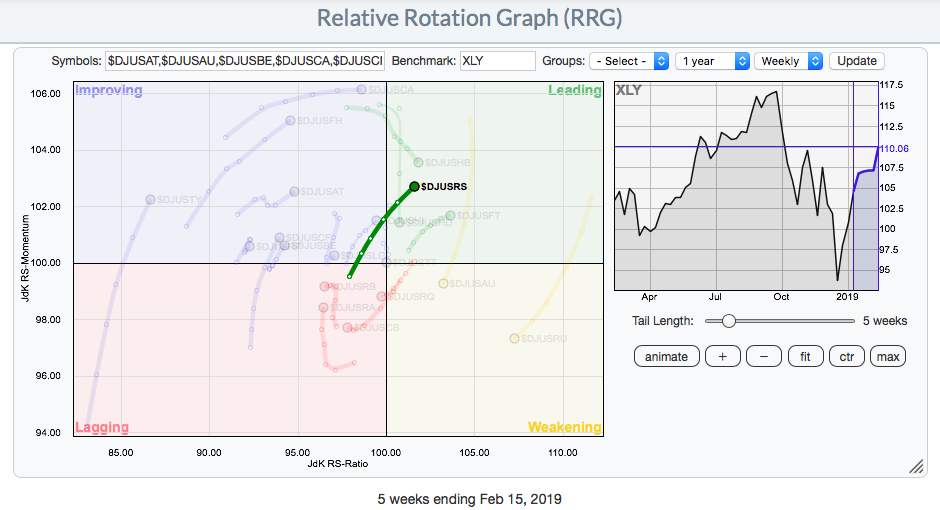
But the relative strength evaluation doesn't stop there. We know that the XLY is grabbing more than its fair share of the money, but which areas of consumer discretionary are strong? Here's the current RRG chart to illustrate this breakdown of consumer discretionary:
 Specialty retailers ($DJUSRS) are surging relative to the XLY, its sector ETF. So now we know that the DJUSRS is helping to lead the XLY higher. Are we done now? Nope.
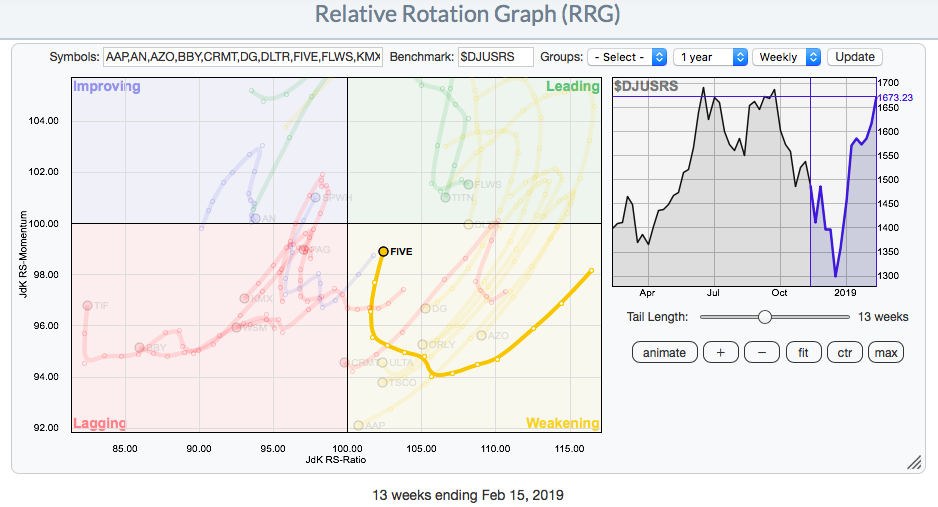
Why not delve into the specialty retailers to find individual stocks that are leading? The stocks below are the large cap, mid cap and small cap specialty retailers, but I'm only including small caps with SCTR scores above 90 to keep our list somewhat manageable:
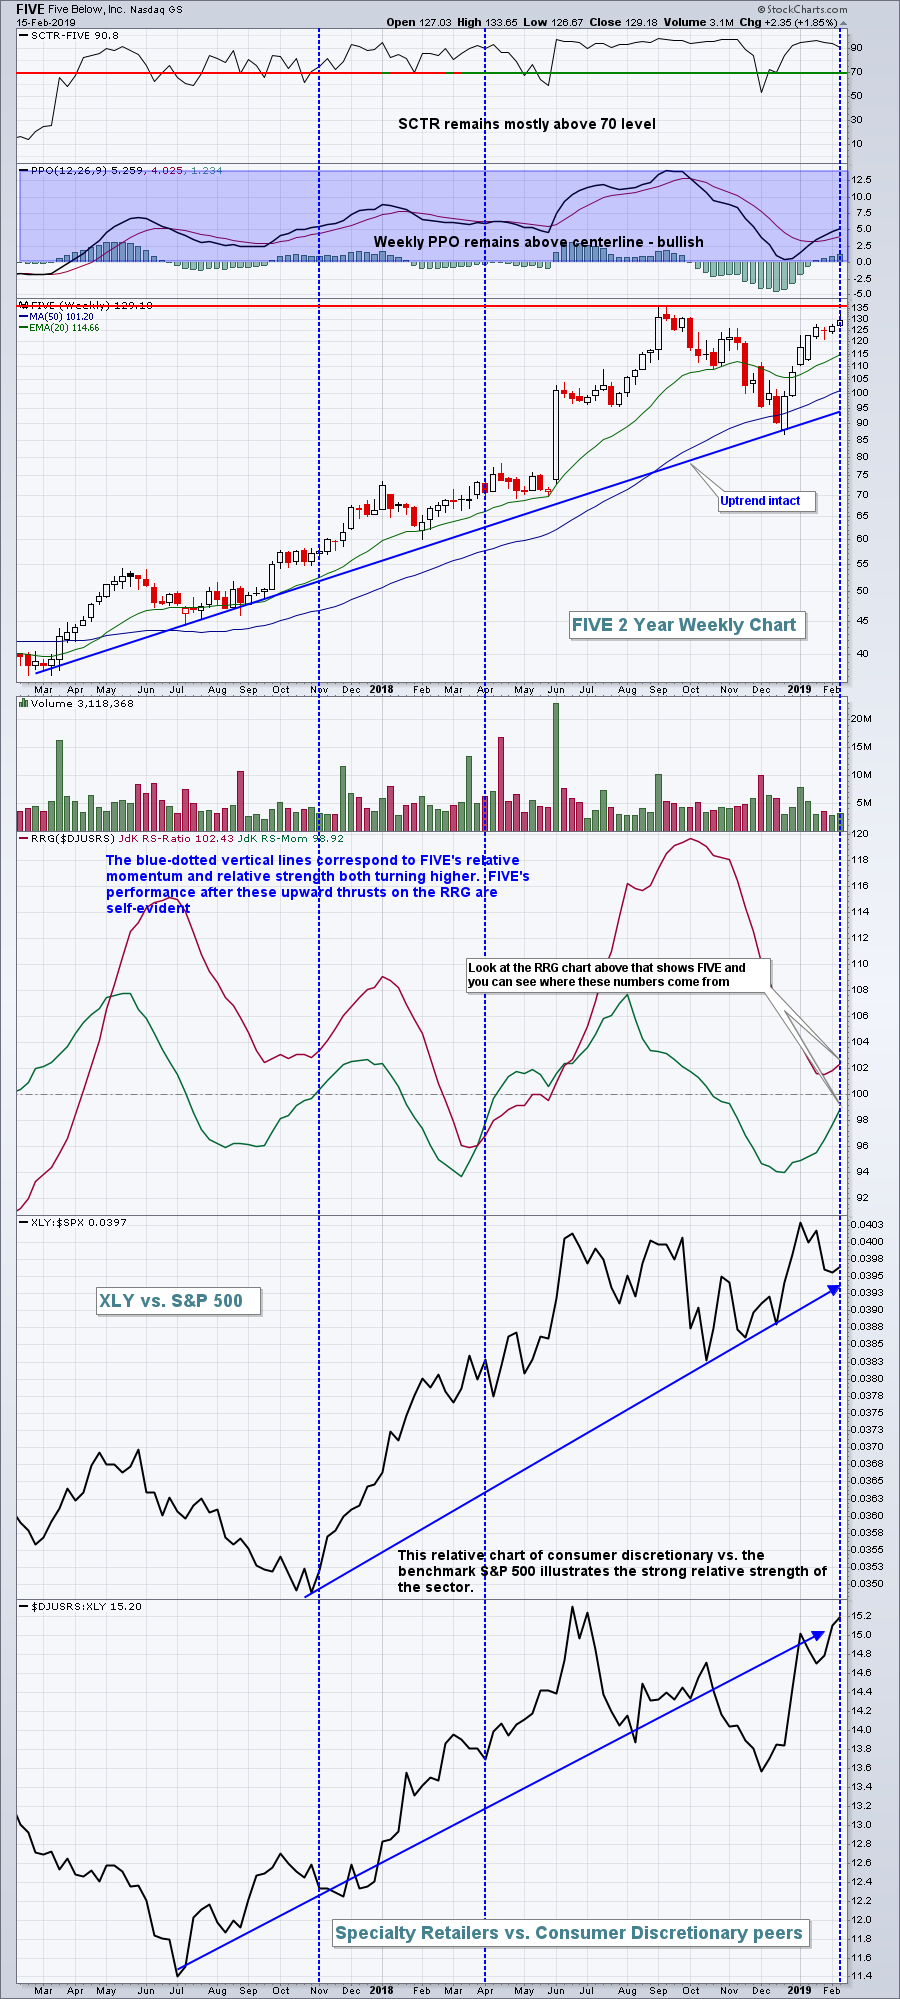
 In addition to moving into the leading quadrant from "improving", it's also many times bullish to see a stock or index turning back up from "weakening" to "leading". There's nothing wrong with a leading stock taking a break for a period of time before leading again. Five Below, Inc. (FIVE) is a great example and I've tracked its relative progress over the past 13 weeks to cover an entire quarter. Three months ago, FIVE was waaaaaaay over to the right side of this RRG chart, indicative of massive outperformance and relative strength. While its relative strength weakened during a profit taking period in late 2018, relative strength is returning again in 2019 just as FIVE approaches a possible breakout technically. If you want to see how all of this looks on a SharpChart, check this out:
 While nothing in this article guarantees future profits from being long FIVE, I hope it does illustrate the types of stocks that you want to consider trading at the appropriate time. Using relative strength to identify potential investing/trading candidates is a sound discipline, but employing a risk management strategy to maximize gains and limit losses is the next step in the process.
Using facets of relative strength and my Strong Earnings ChartList, I provided the EarningsBeats.com community a list of my Top 10 Stocks on November 19, 2018. From that date through Friday, February 8, 2019, they gained on average 17% while the S&P 500 inched higher at less than 1%. 8 of the 10 stocks provided gained ground and outperformed that benchmark index.
I am returning to EarningsBeats.com to provide my new Top 10 list on Tuesday, February 19th at 4:30pm EST. I'll further discuss the importance of relative strength at this event. EarningsBeats.com is offering to provide you their Strong Earnings and Weak Earnings ChartLists for the next 90 days for a nominal amount. Having used this approach to trade stocks for the last several years, I can tell you that using this list in conjunction with relative strength principles discussed above significantly improved my trading performance. I hope you'll join me. In order to download the ChartLists from EarningsBeats.com, however, you do need to be at least an Extra member here at StockCharts.com.
For a free 30 day trial to StockCharts.com, CLICK HERE.
To join me on Tuesday at the EarningsBeats.com event, CLICK HERE for further details.
Happy trading!
Tom
