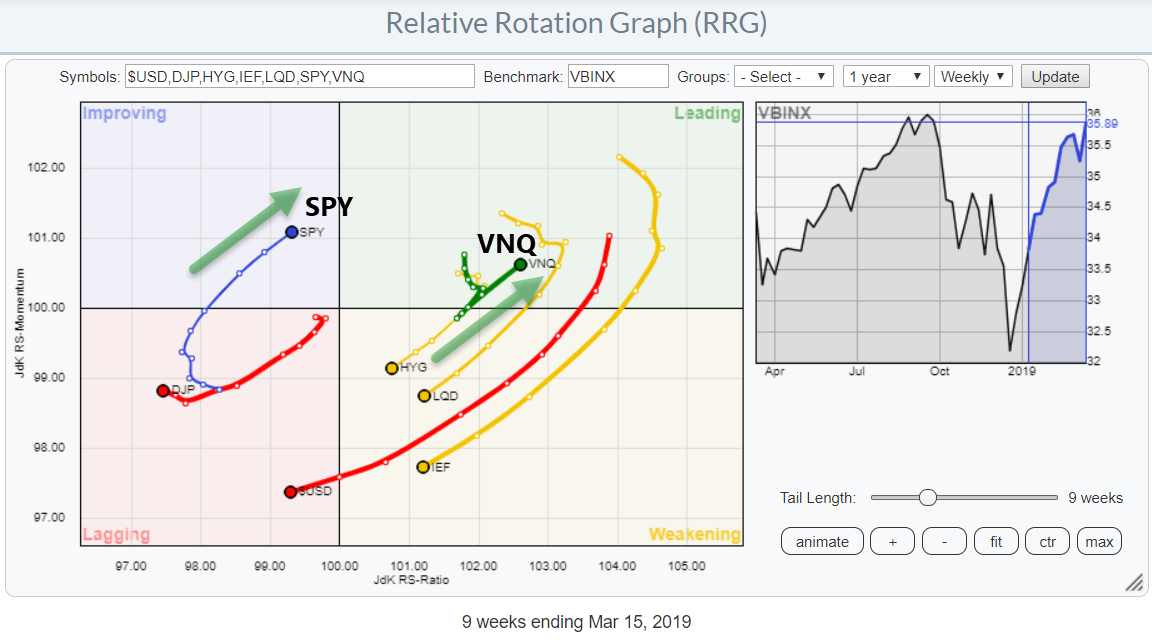
 This Relative Rotation Graph shows the rotation for asset classes over the past 9 weeks. The main observation is that fixed income related asset classes are all inside weakening and heading, rapidly, towards lagging.
SPY (stocks) is close to returning into the leading quadrant. The strongest rotation at the moment, Leading-Weakening-Leading, is now shown by Real Estate.
This is interesting as Real Estate is both an asset class but, since not too long, also a sector in the equity universe.
The asset class RRG shows VNQ rotating at the right-hand side of the graph and returning into the leading quadrant after a short stint through weakening. This makes Real Estate the strongest asset class measured on the JdK RS-Ratio scale.
Together with SPY, VNQ is the only asset class rotating at a strong RRG-Heading (0-90 degrees) at the moment.
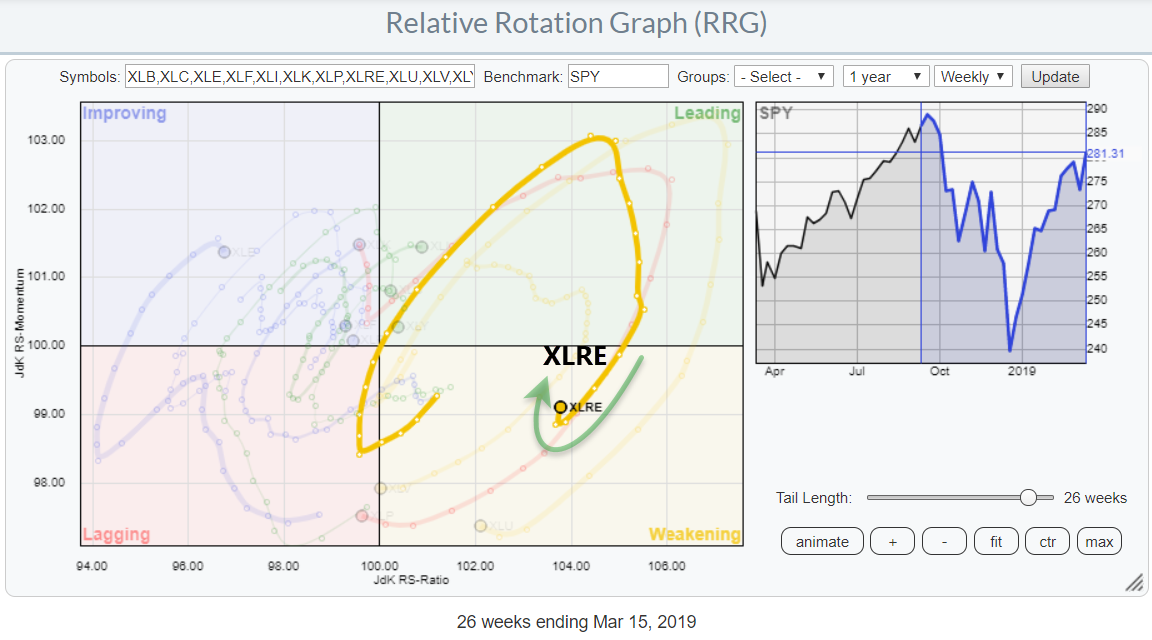
On the sector RRG
 On the sector RRG, Real Estate (XLRE), is also furthest to the right. Making it the strongest sector within the S&P 500 universe at the moment, based on the JdK RS-ratio scale.
What makes things extra interesting is the fact that XLRE has just started to curl back up again which suggests that XLRE is ready to start its second leg of the existing relative uptrend against SPY.
XLRE and VNQ both cover the Real Estate asset class. The difference between the two is that XLRE only covers stocks (REITs) that are part of the S&P 500 index while VNQ covers a much broader part of the Real Estate universe.
From an investment perspective, they show very similar performance over time with a correlation very close to 1.
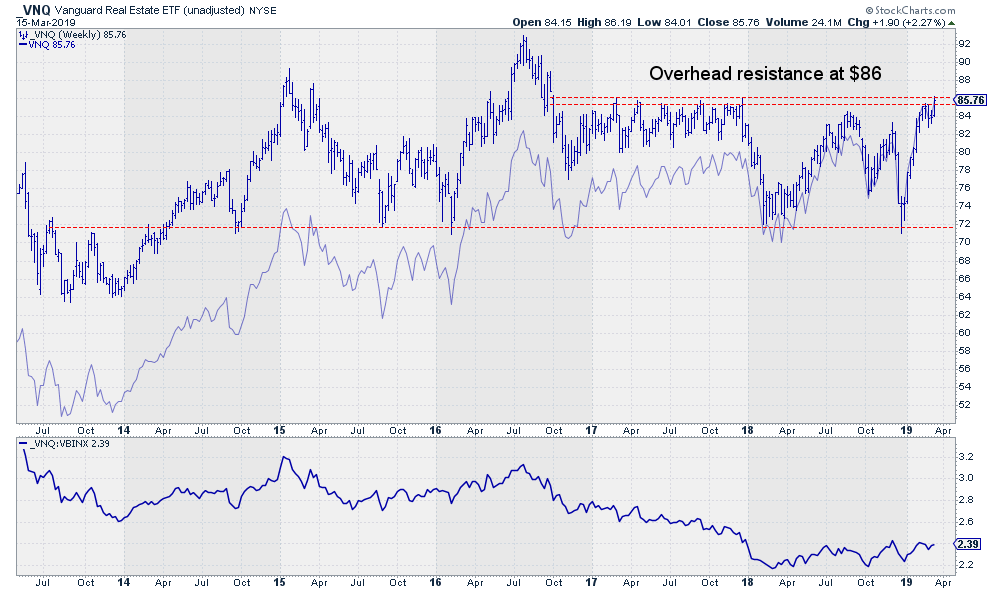
Vanguard Real Estate ETF - _VNQ
 The chart above shows both the adjusted and unadjusted price series for VNQ. The unadjusted price is shown as the bar-chart (_VNQ) and the adjusted price (VNQ) is shown as the dimmed line chart.
As you can see dividends make up an important part of the performance for this sector/asset class. Based on this adjusted chart VNQ has recently broken to new highs.
On the unadjusted chart, this is not the case.. yet.
The range between $85.50 - $86 is showing up as an important area of resistance. Especially in 2017 this level was tested and rejected multiple times. The high in 2018 fell two dollars short of that level and the high earlier this year was also formed against that resistance area.
At the moment VNQ is trading inside that $85.50 - $ 86 range and seems ready to break. For me, a break on the unadjusted chart is more important as it reflects a break of a level where people actually traded which means that it is more "in their head" than a backward adjusted price to reflect dividends.
Also on the relative chart, VNQ is close to breaking above its previous highs which will reinforce its strong rotation on the Relative Rotation Graph.
All in all, Real Estate is an asset class/sector to keep an eye on in coming weeks as it seems to be re-installing its leading position.
My regular blog is the RRG blog If you would like to receive a notification when a new article is published there, simply "Subscribe" with your email address using the form below.
Julius de Kempenaer | RRG Research
RRG, Relative Rotation Graphs, JdK RS-Ratio, and JdK RS-Momentum are registered TradeMarks ®; of RRG Research
Follow RRG Research on social media:
Feedback, comments or questions are welcome at Juliusdk@stockcharts.com. I cannot promise to respond to each and every message but I will certainly read them and where reasonably possible use the feedback and comments or answer questions.
If you want to discuss RRG with me on SCAN, please use my handle Julius_RRG so that I will get a notification.


