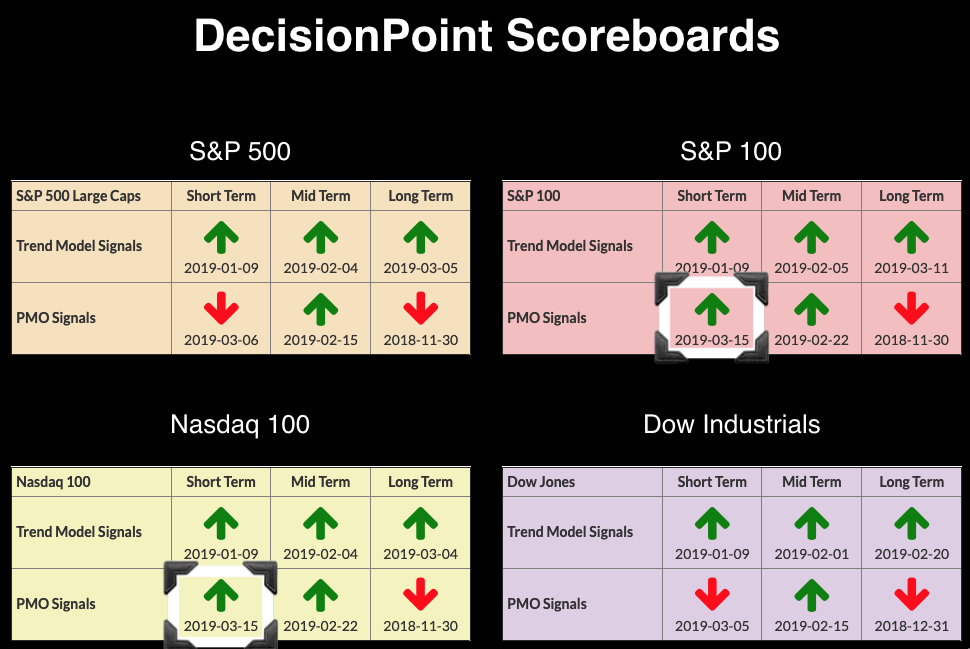
I have a chart at the bottom of this article that will explain my moving out of the bear market camp. Yes, it is delayed, but, as I explained before the December crash, I'd rather miss a bottom and rally than be hanging on for dear life during a quick and painful decline. More BUY signals are appearing on the DecisionPoint Scoreboards. Today, two new PMO BUY signals were triggered when they crossed above their signal lines. Don't get too excited, though, as the VXN and VXO suggest a decline for both next week.
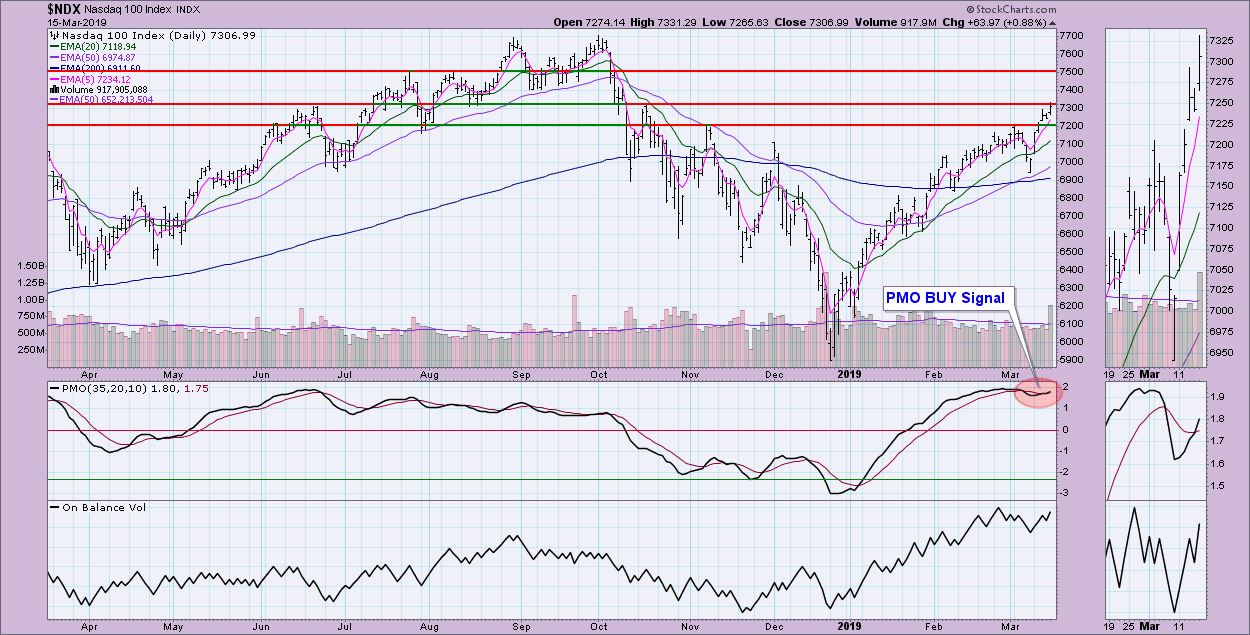
I've annotated the new PMO BUY signal, as well as two areas of overhead resistance that need to be tackled quickly. There is still a negative divergence between OBV tops and price tops that also could suggest a decline soon.
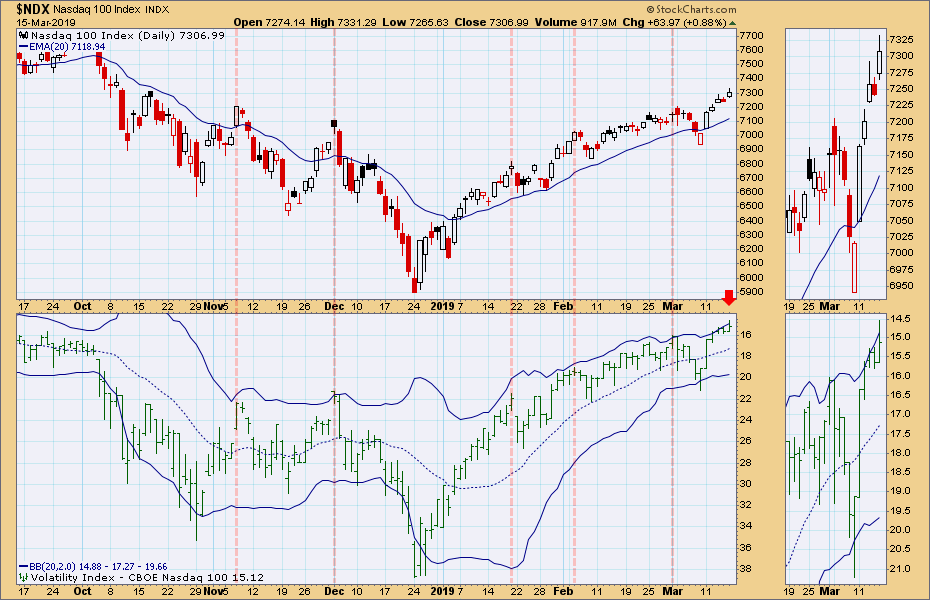
I've inverted my scale on the volatility indexes so that overbought is at the top and oversold is at the bottom. Note that, when the upper Bollinger Band is penetrated, it generally leads to a short-term decline (or longer). This was a nice rally, but it is time for a pullback.
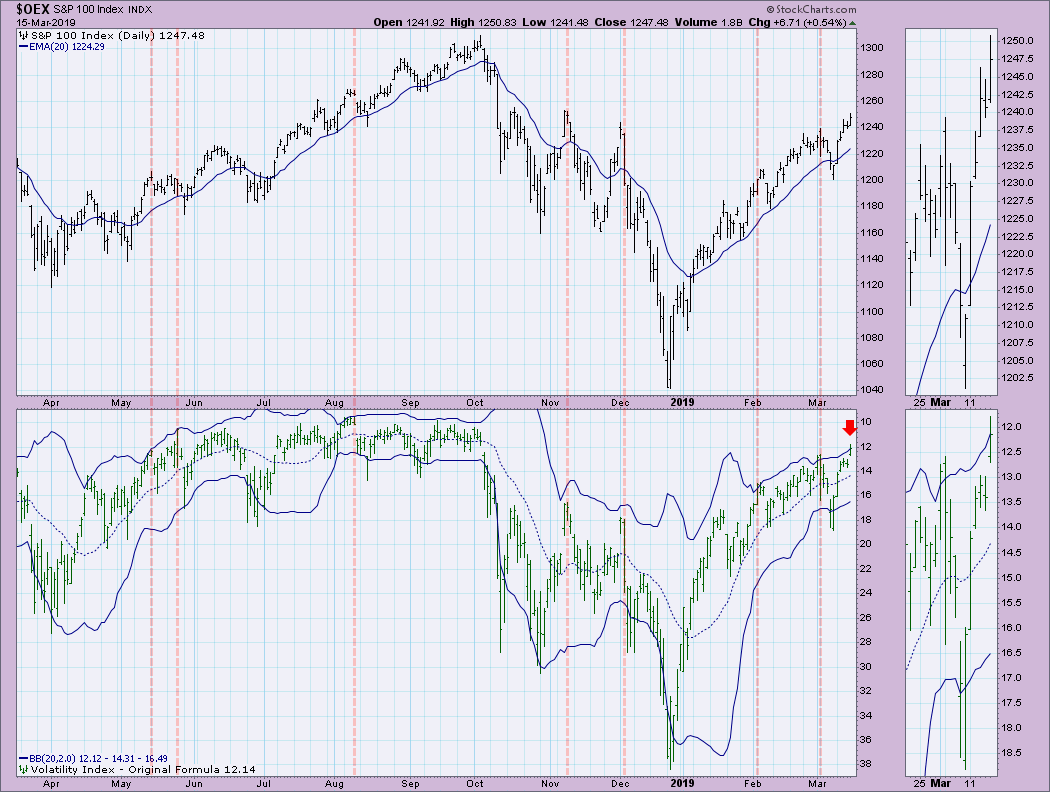
The OEX is facing the same situation, with overhead resistance nearby and a negative divergence with the OBV, based on the February OBV top and current reading that is below it. Both PMO BUY signals are arriving in somewhat overbought territory.
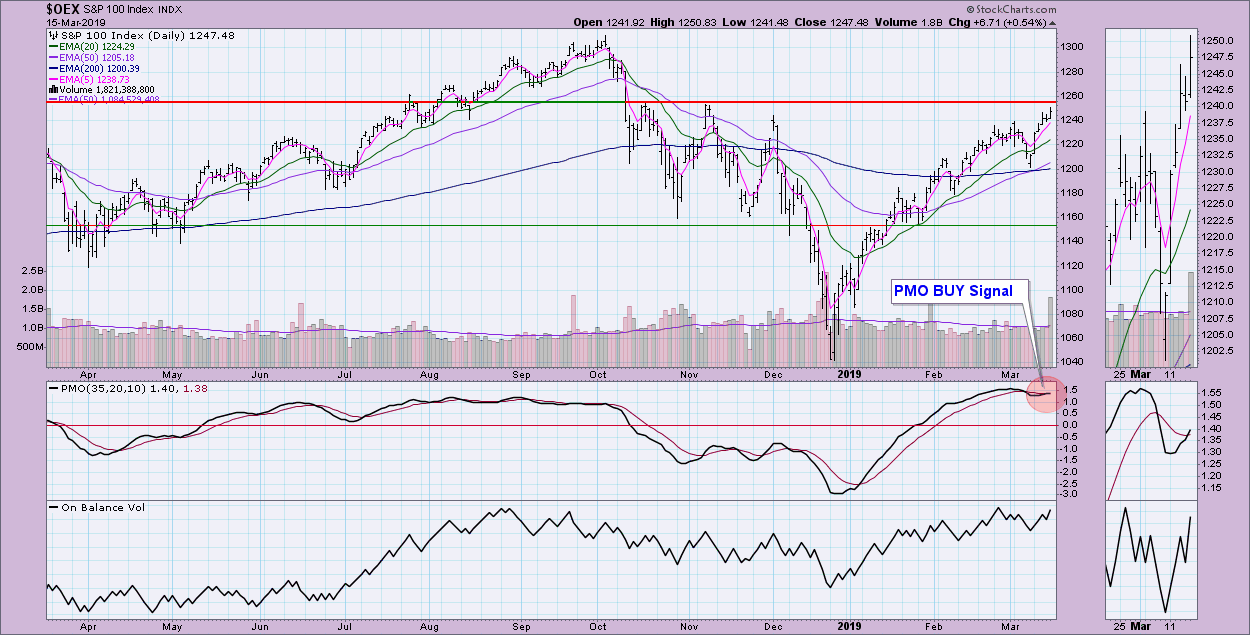
Again, the volatility index for the OEX is showing a penetration of the upper Bollinger Band, which suggests a decline in the coming week.
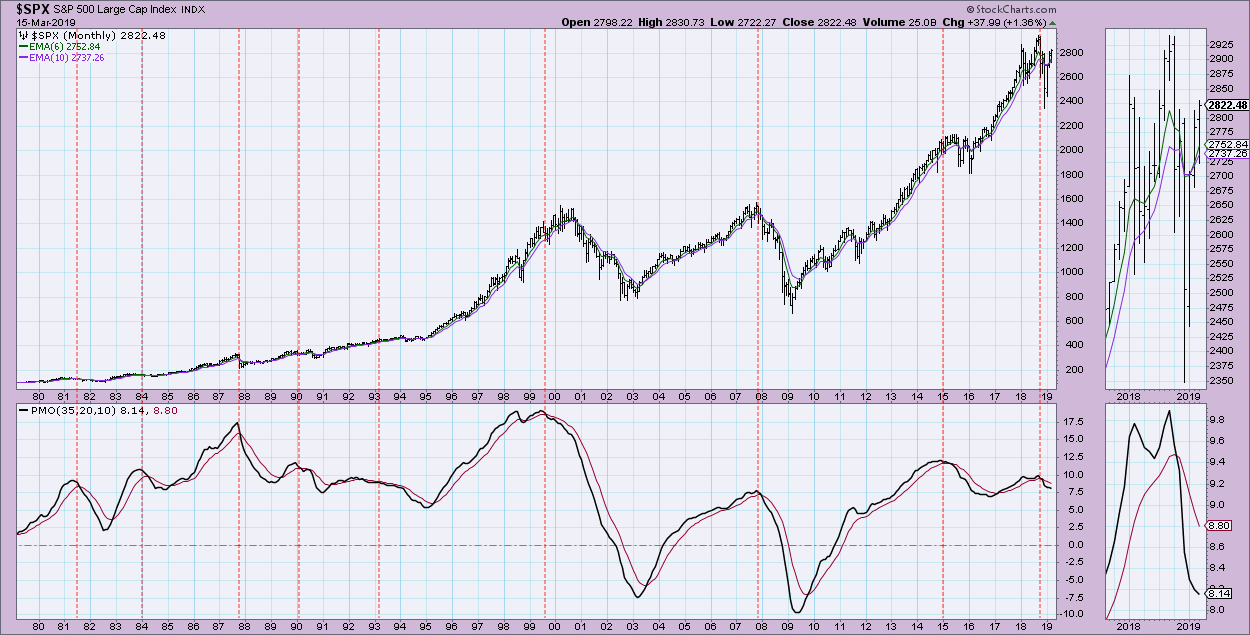
So why am I now unofficially a bull? The monthly PMO, which has been my guide throughout, is finally starting to decelerate. It hasn't turned up, nor has it had a positive crossover. When it turns up, I'll officially be a bull. For now, though, my stance has moved bullish. There's no point in fighting the charts. My analysis suggests that we won't test the December lows and, until the monthly PMO turns up, I think we are still vulnerable to a sizable correction.
Watch the latest episode of DecisionPoint with Carl & Erin Swenlin LIVE on Fridays 4:30p EST or on the StockCharts TV YouTube channel here!
Technical Analysis is a windsock, not a crystal ball.
Happy Charting!
- Erin
Helpful DecisionPoint Links:
DecisionPoint Shared ChartList and DecisionPoint Chart Gallery
Price Momentum Oscillator (PMO)
Swenlin Trading Oscillators (STO-B and STO-V)
**Don't miss DecisionPoint Commentary! Add your email below to be notified of new updates"**


