Editor's Note: This article was originally published in Martin Pring's Market Roundup on Tuesday, April 9th at 1:08pm ET.
Global stocks, represented in the form of the MSCI World Stock ETF (ACWI), peaked in January of last year and gradually worked their way lower into late December. However, a remarkable turnaround has enabled the price of this ETF to complete a 6-month inverse head-and-shoulders and crash through its bear market trend line. In addition, Chart 1 shows that my Global A/D line has completed a 12-month consolidation pattern and broken out decisively on the upside. This broadly-based advance suggests supports the idea that the that the ACWI breakout is for real. Even though several measures of market momentum are currently overstretched on the upside, I am going to assume that’s the case - that is, unless the price experiences a daily close under the previous minor low and two breakout trend lines in the $70.50-$71 area.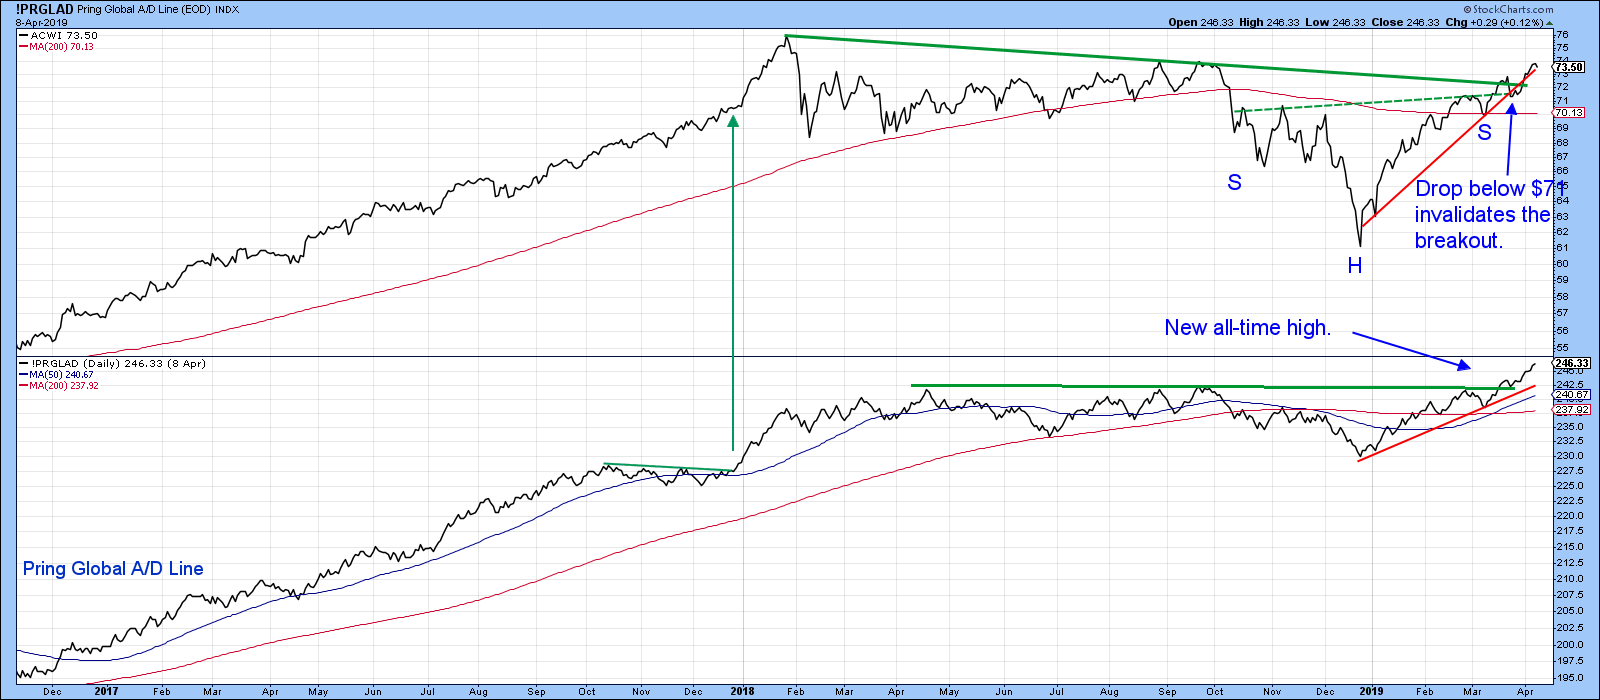
Chart 1
Chart 2 indicates that the Dow Jones Global Index ($DJW) has also experienced a breakout. The chart also features my Global Diffusion indicator, calculated by monitoring a basket of individual country ETFs that are above their 40-day MAs. That indicator has just triggered a buy signal by crossing above its 10-day MA. Note that the signal is obviously happening at a very high, and therefore risky, level. However, the three green arrows, which track buy signals triggered at a similar level, were all followed by higher prices due to strong upside momentum at the time.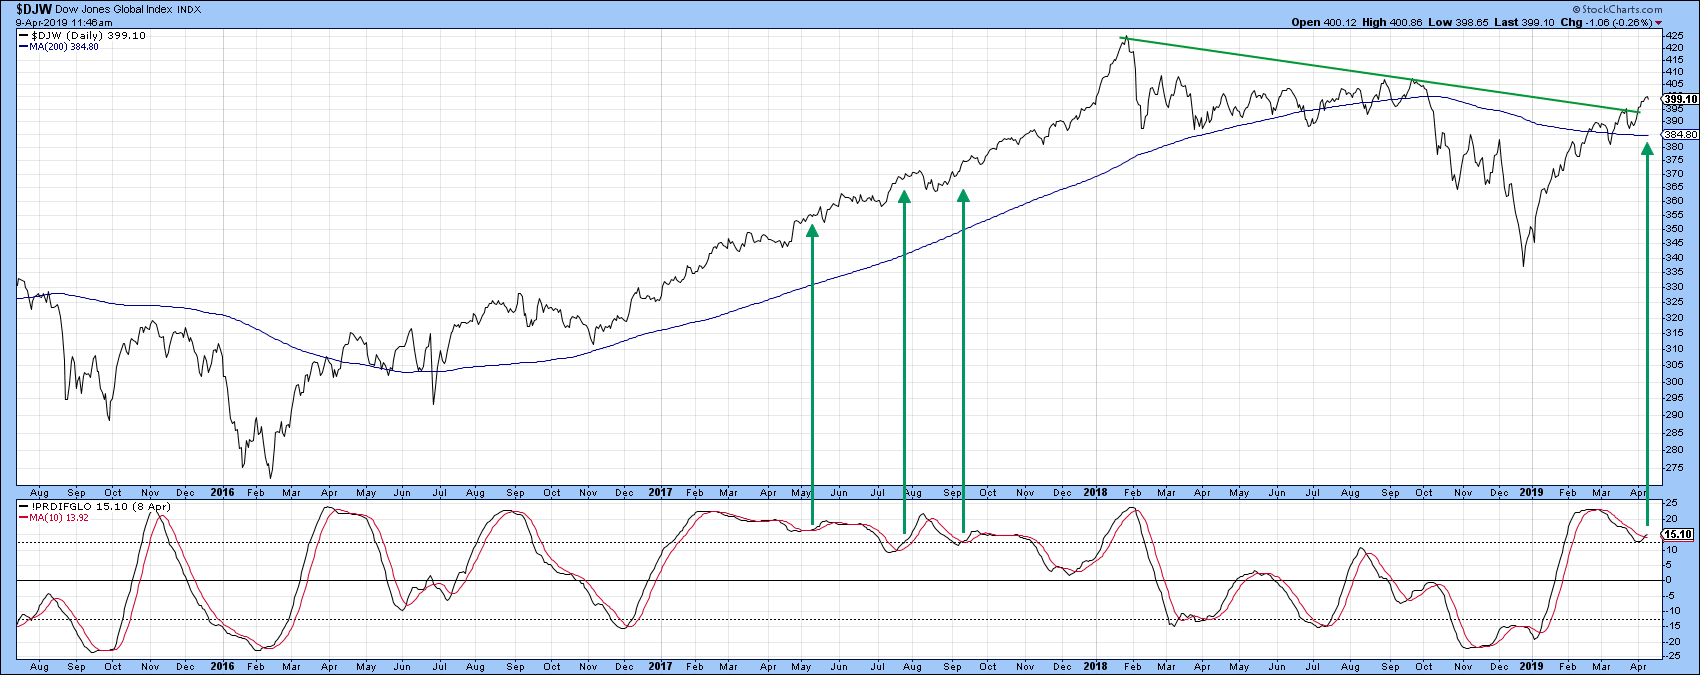
Chart 2
Chart 3 features a 14-day RSI for the Global Index. The pink shadings indicate bear markets, in which upside momentum is typically constrained at lower levels than during the course of a bull market. Note that, once the bear gets underway, the RSI is not able to exceed the dashed green horizontal line at the 60 level. During the course of a bull market, by contrast, the RSI does not operate under these constraints as it frequents the blue overbought zone. A high RSI reading, therefore, offers one sign that the trend has changed from bear to bull. This rule does not work for every security, which means that, if you want to adopt this approach, it’s important to check at least 10 years of history for the item in question. Firstly, you'll want to see whether it behaves differently in a bull than a bear market. Secondly, you'll need to get a feel for the specific ranges at play. In the case of the $DJW, it seems that a rally in the RSI above the 65-zone (solid green line) is sufficient to confirm that a primary bull market is underway. The three previous instances have been flagged with the green arrows. While some of these signals came well after the low, each was followed by a significant advance. In the current situation, the RSI has rallied to the 61 level but has yet to trigger that magic 65. Given the breakout in both the price and A/D Line, I think there is a good chance that it will.
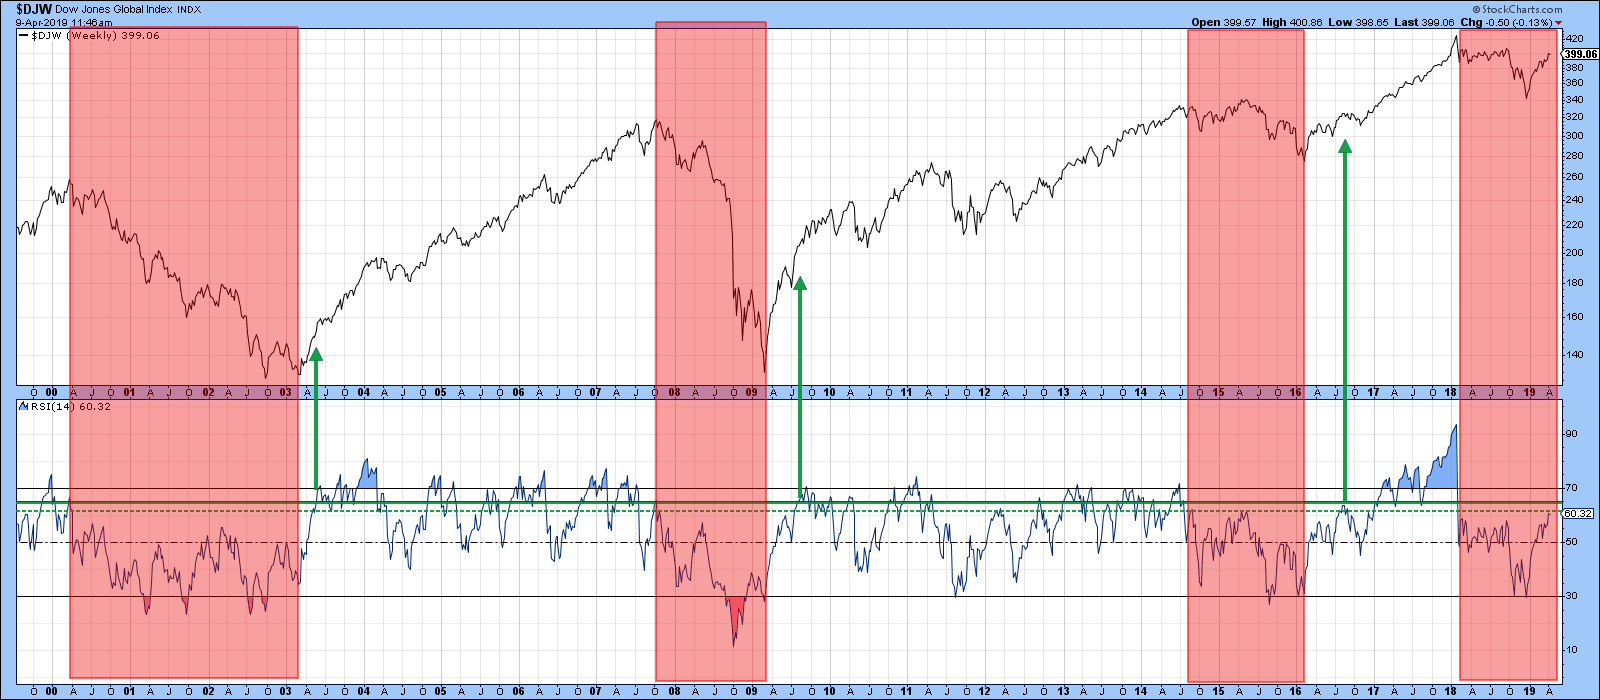
Chart 3
Chart 4 compares the relative performance of several regional ETFs to the MSCI World ETF itself. The chart shows that the US, in the form of the SPY, has been out-performing the world. As long as SPY can maintain a position above the 2010-2019 red uptrend line, I am going to assume that is still the case. Should that line be violated with a break below the 38 level, that would suggest that leadership had been transferred to other parts of the world for the first time in a decade. We will only know which region is favored when the technical position actually changes. Right now though, the emerging market space seems to be the most likely, as it is closer to a trend line violation than either Europe or Asia.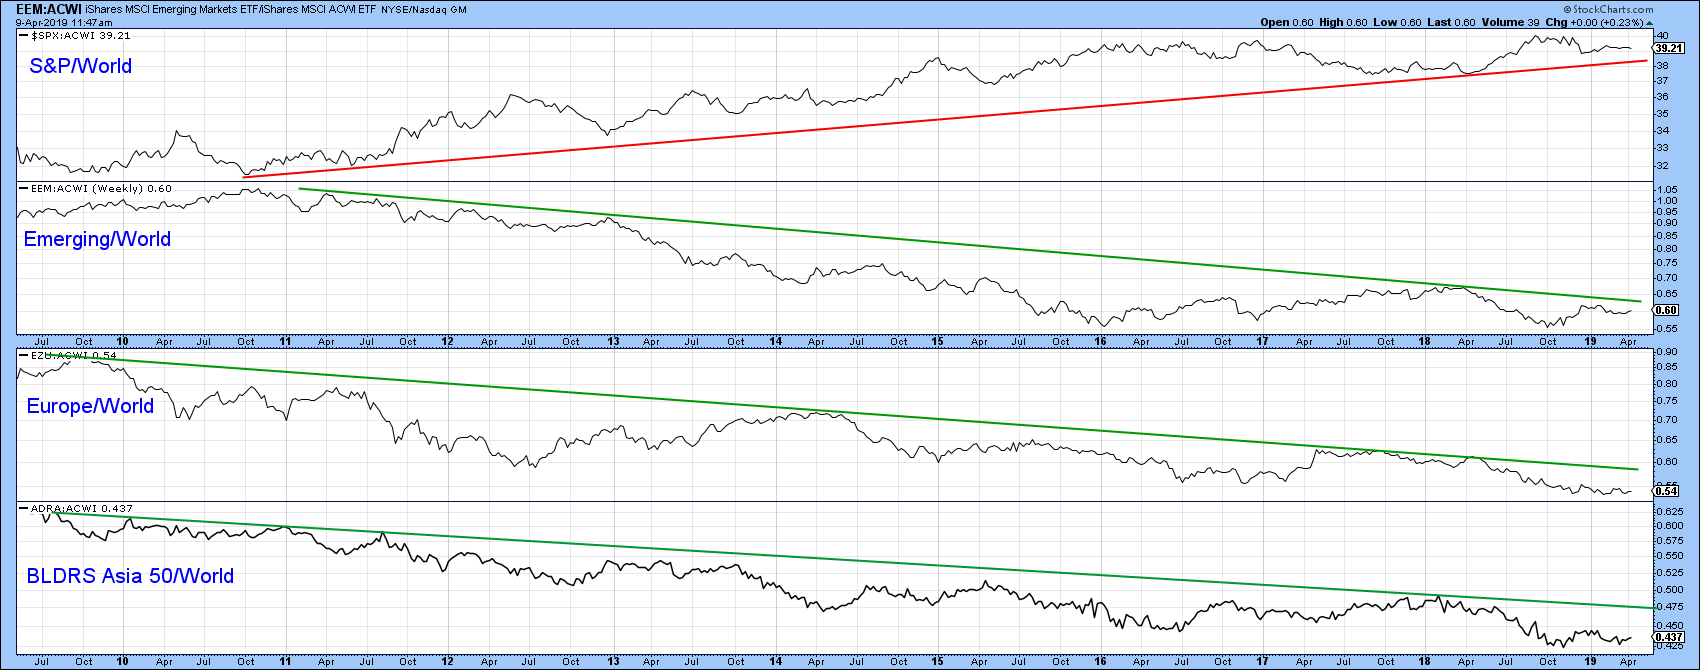
Chart 4
Good luck and good charting,
Martin J. Pring
The views expressed in this article are those of the author and do not necessarily reflect the position or opinion of Pring Turner Capital Group of Walnut Creek or its affiliates.


