Editor's Note: This article was originally published in John Murphy's Market Message on Friday, April 19th at 10:21am ET.
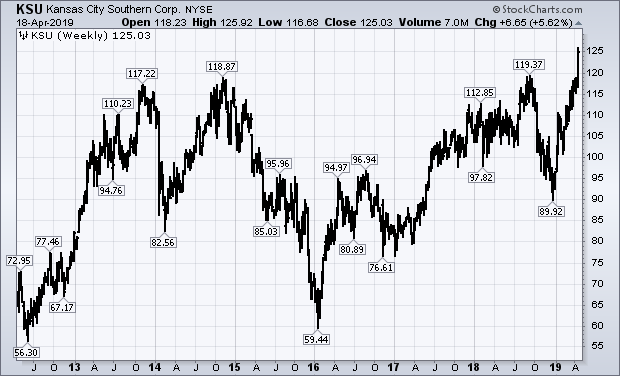
Two stock groups did better than the rest of the market this week. Transportation stocks had another strong week. As did the Industrial Sector SPDR (XLI) which was the week's strongest sector. Both have one group to thank for their strong performance. And that's railroads which are included in both groups. And the rails have become market leaders in both. Chart 1 shows the Dow Jones US Railroad Index climbing this week to a new record. The rails have been the strongest part of the Dow Transports all year. They've also become leaders in the industrial sector. The solid line in the upper box is a relative strength ratio of the railroad index divided by the Industrial SPDR (XLI). That ratio hit a new high this week. A ratio of the rails divided by the SPX did the same. All of the rail stocks hit record highs this week, and were XLI leaders. Kansas City Southern (KSU) was the week's biggest rail percentage gainer. And achieved an impressive bullish breakout.
The weekly bars in Chart 2 show KSU breaking through its 2014 and 2018 highs to a new record. That's a positive sign for that stock, the Dow Transports, and the Industrial sector (XLI).
Chart 1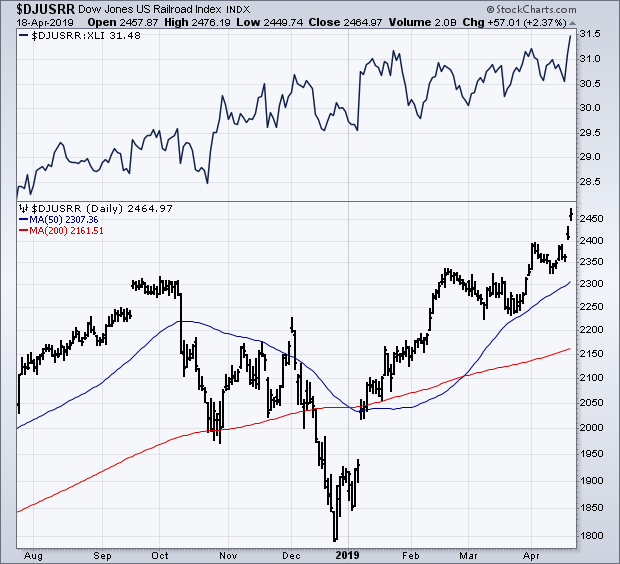
Chart 2