In my ChartWatchers article from two weeks ago, I provided insights into signals that your stock may be poised to report earnings above Wall Street estimates. Given that the markets are currently rewarding positively reporting companies with an average 2.1%+ boost in price* (and in many cases, much more), you may want to review my article here.
That said, there’ve been enough major earnings-related blowups this week that could easily temper your appetite for buying stocks right before earnings. These include Irobot Corp (IRBT) which has plummeted over 23% since reporting, as well as Xilinx Inc. (XLNX) which is down 15% since its earnings release on Wednesday.
With this possible downside risk in mind, today we’re going to review you how to successfully trade stocks after they’ve reported earnings. And it’s going to have everything to do with interpreting the chart of the stock. And it’s going to have everything to do with interpreting the chart of the stock.
My focus on earnings is simple - studies have proven that the primary driver of big, winning stocks is strong earnings.
These studies were conducted by William O’Neil who I worked with for 15 years and they involved reviewing the charts of thousands of top performing stocks going back over 100 years. Again and a gain, those stocks that consistently posted strong earnings went on to great gains. There were other common traits among these winners as well, but far and away strong earnings was the main reason for outperformance. I’ll review the other commonalities in future articles.
The good news for investors is that you don’t have to buy the stock before the company reports. You can wait for the good news to be released and still enjoy substantial gains.
The reason for more upside potential after the release of positive earnings is twofold. First, oftentimes analysts will subsequently raise their guidance for the stock which will in turn bring more buyers. And secondly, Institutions who may have missed the chance to get in before the earnings are now interested. These Institutions take time to build their positions and the net result will be a stock in an uptrend while accumulation takes place.
After uncovering a company that’s reported solid earnings, you’ll need examine the charts to determine if the stock is in a position to trade higher. In other words, is the stock technically sound?
Below are two examples of winning stocks from the Q4 earnings season earlier this year.
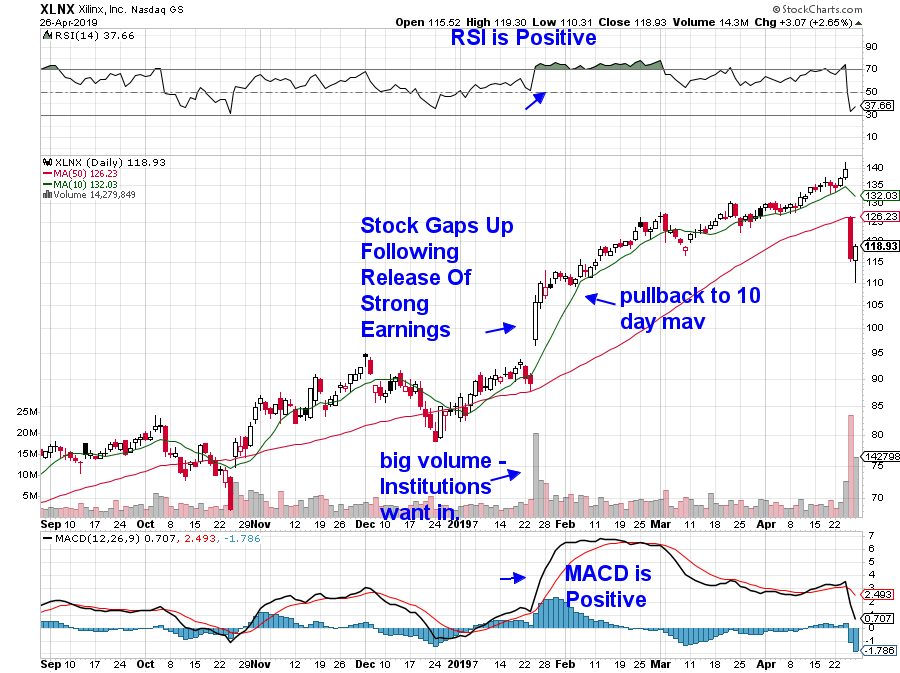
In the first example, the stock gapped up following strong results. This is not uncommon and can be the start of much bigger gains. Rather than chase the stock, you can oftentimes wait for a pullback to its 10-day moving average as the stock takes a pause or consolidates before taking off again.
You’ll also need to see a positive RSI and MACD to confirm a continuation of the uptrend coupled with the price remaining above its upward trending 10-day simple moving average.
DAILY CHART OF XILINX INC. (XLNX)
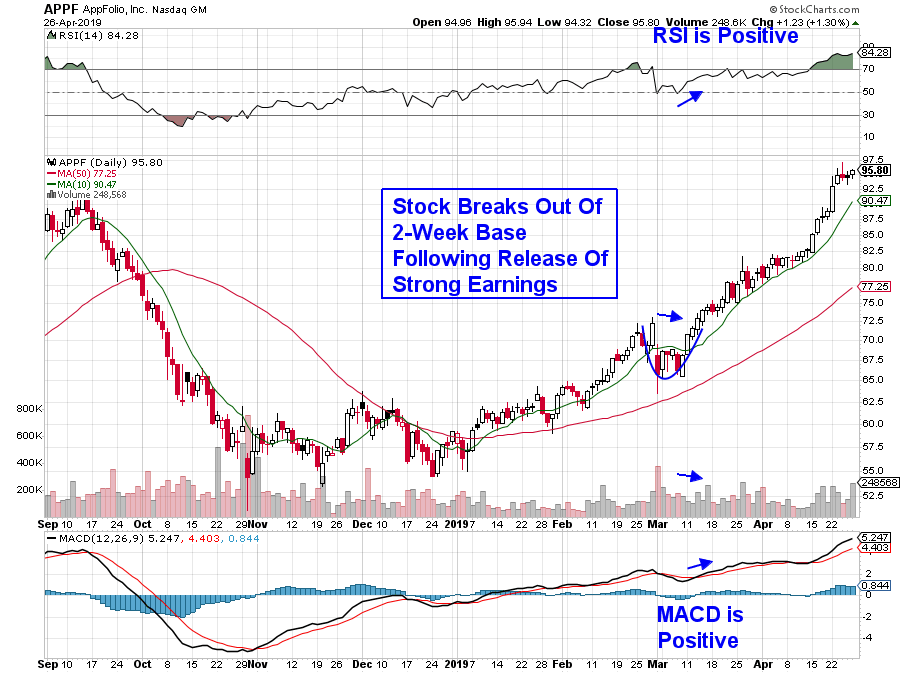
In this next example, the company reported very strong earnings in late February and then pulled back in a move that was in line with the broader markets. This is another common occurrence as a sharp advance can be met with a pullback or sideways actions as a way of consolidating the big gain.
In this case, the stocks breakout of a 2-week base on volume was an ideal entry point as it occurred on volume. This volume pointed to Institutional participation which helped support a continuation of the stock’s uptrend. Again, you want to use the RSI and MACD to confirm that the stock is technically sound as its continuing to find support at its upward trending 10-day moving average.
DAILY CHART OF APPFOLIO INC. (APPF)
 Overall, earnings season can be an ideal time to be on the lookout for stocks poised to outperform the markets. In addition to looking for a substantial price move on the day of the report, you’ll want to see the move occur on volume. Oftentimes, sorting the Market Movers List on StockCharts.com by most active will quickly put you in front of these candidates- particularly when we’re in the thick of earnings season such as now.
*per Factset Earnings Insight Report
- Mary Ellen McGonagle
Founder, MEM Investment Research