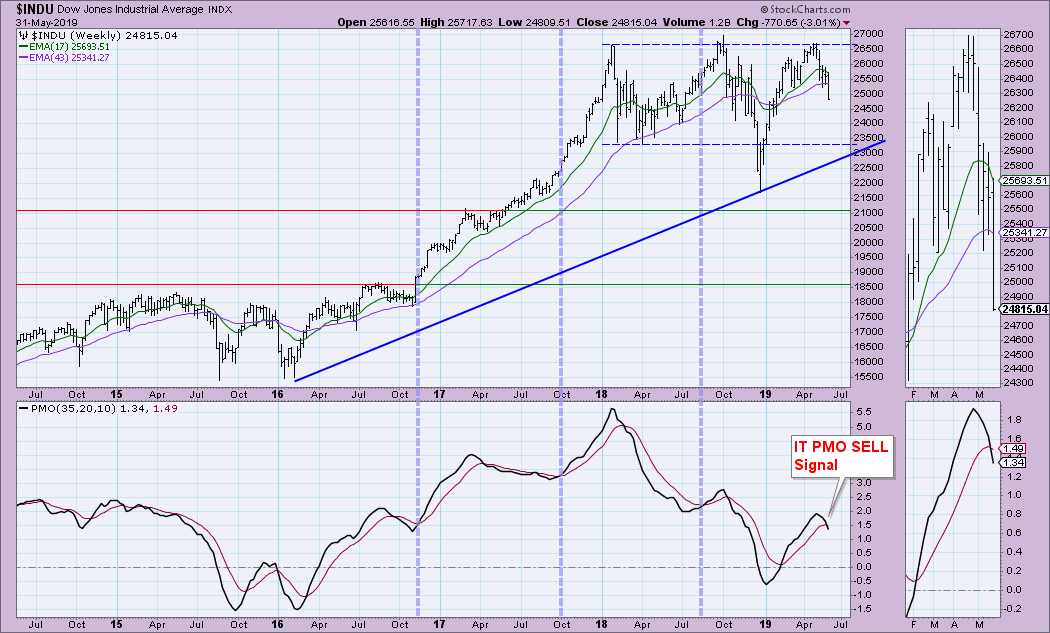
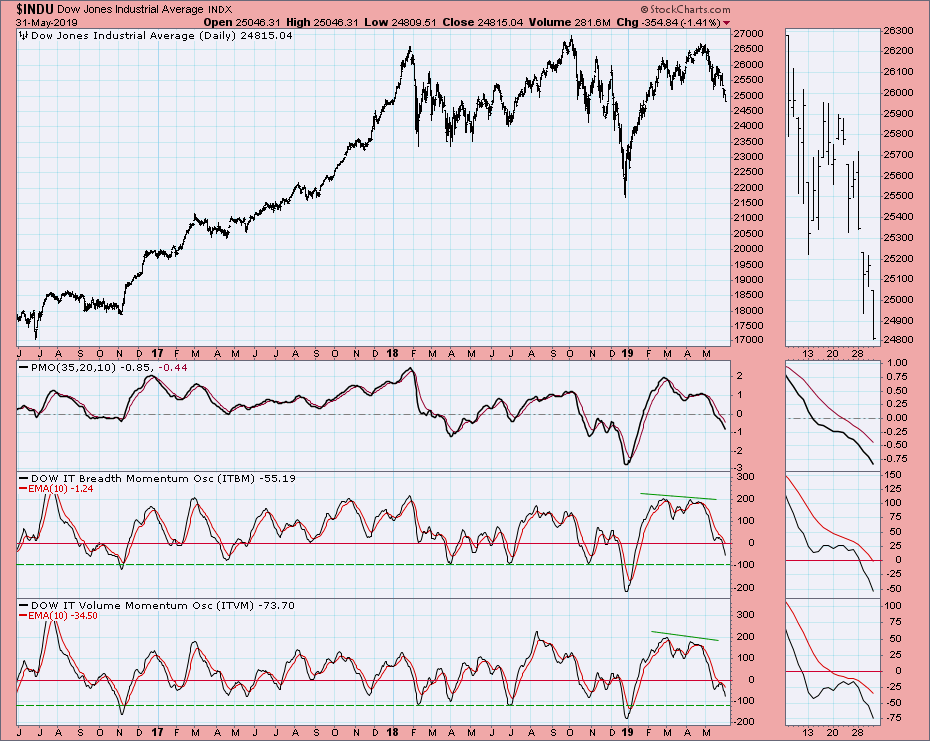
This week, all four of the Scoreboard indexes (SPX, OEX, NDX, Dow) switched to IT Trend Model Neutral signals. This is just added insult to injury, given the ST Neutral and SELL signals that posted earlier this month. Today, the Dow lost its IT Price Momentum Oscillator (PMO) BUY signal. This occurs when the PMO crosses below its signal line on the weekly chart, as seen below.
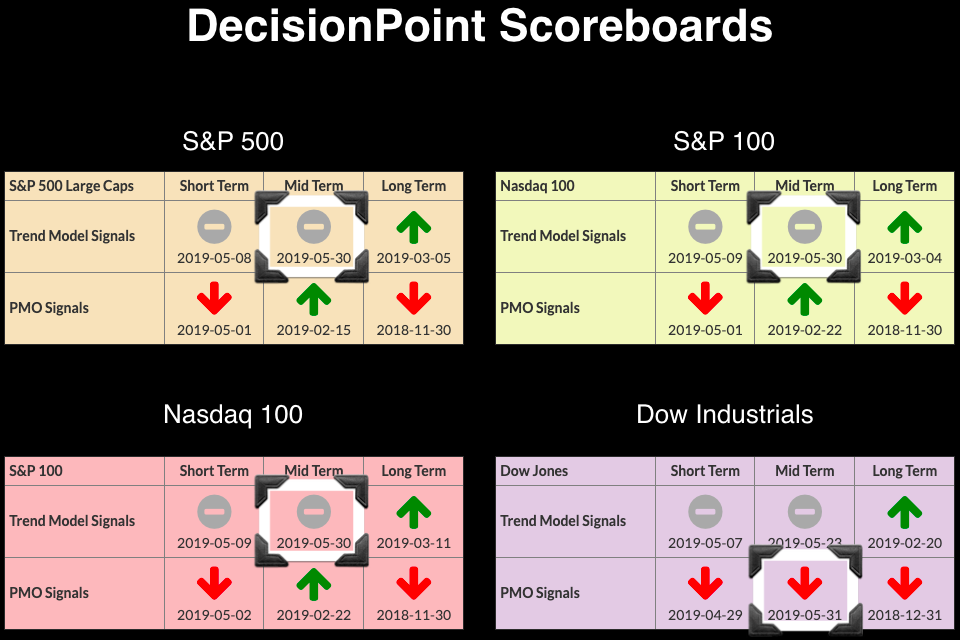
Here's a look at the DP Scoreboards. Carl wrote about the new IT Trend Model Neutral signal for the SPY in his Friday DP Weekly Wrap article. Be sure to read it, as there was also a SELL signal posted today on Oil.
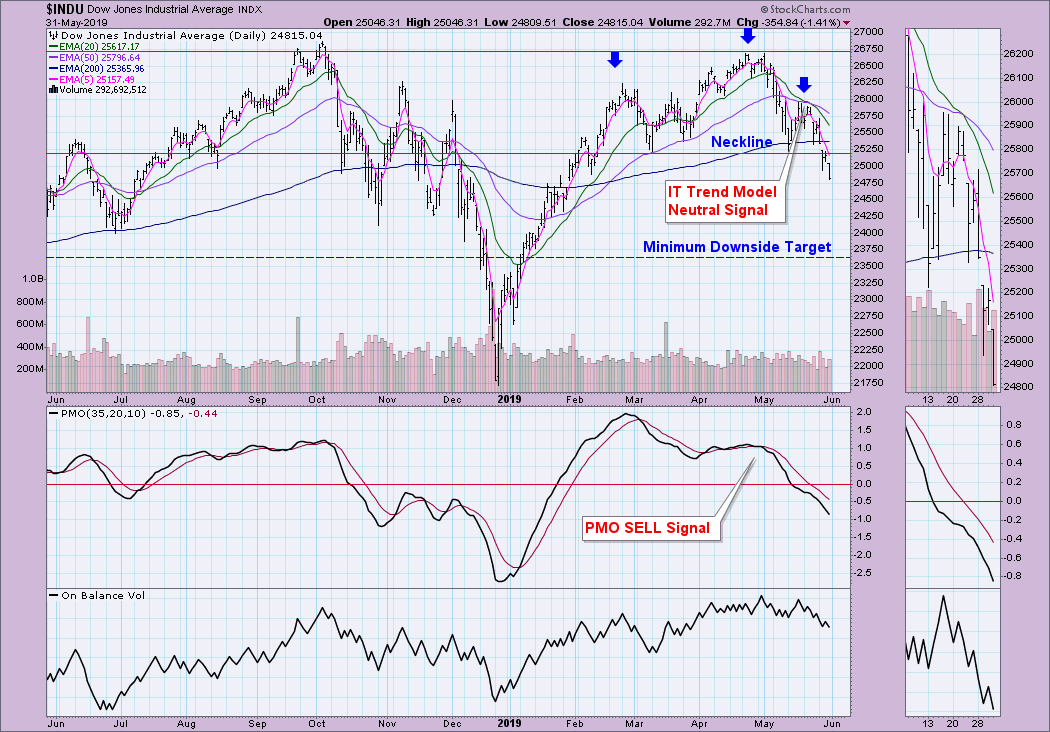
The Dow daily chart below points out the 20/50-EMA negative crossover that generated the Neutral signal. Despite a heavy-loss down day on the Dow, volume wasn't particularly climactic. I don't think this is over yet. In the chart, I've annotated a head-and-shoulders pattern. If you do the calculation by taking the length of the head to the neckline and subtracting it from the neckline, you would get a minimum downside target around 23600.
 In the free DecisionPoint Straight Shots ChartPack in the Dow ChartList, we have the Swenlin Trading Oscillators and the ITBM/ITVM charts. Notice on the STOs below that oscillation above the zero line indicates strength and accompanies rallies. When we start to see climactic moves below the zero line, it is a sign of internal weakness. There is some hope; the STOs are very oversold, which usually means we'd see a reversal. However, it is important to note that these indicators stretched much lower during the bear market and could certainly do so now.
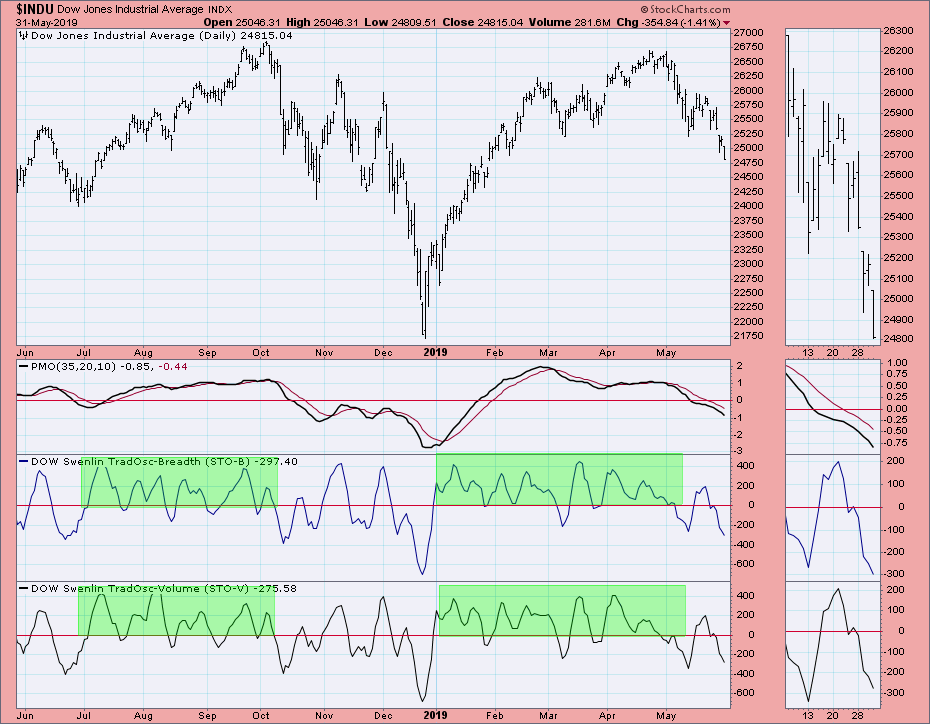
The ITBM and ITVM are very oversold for a bull market, but not so for a correction or bear market move.
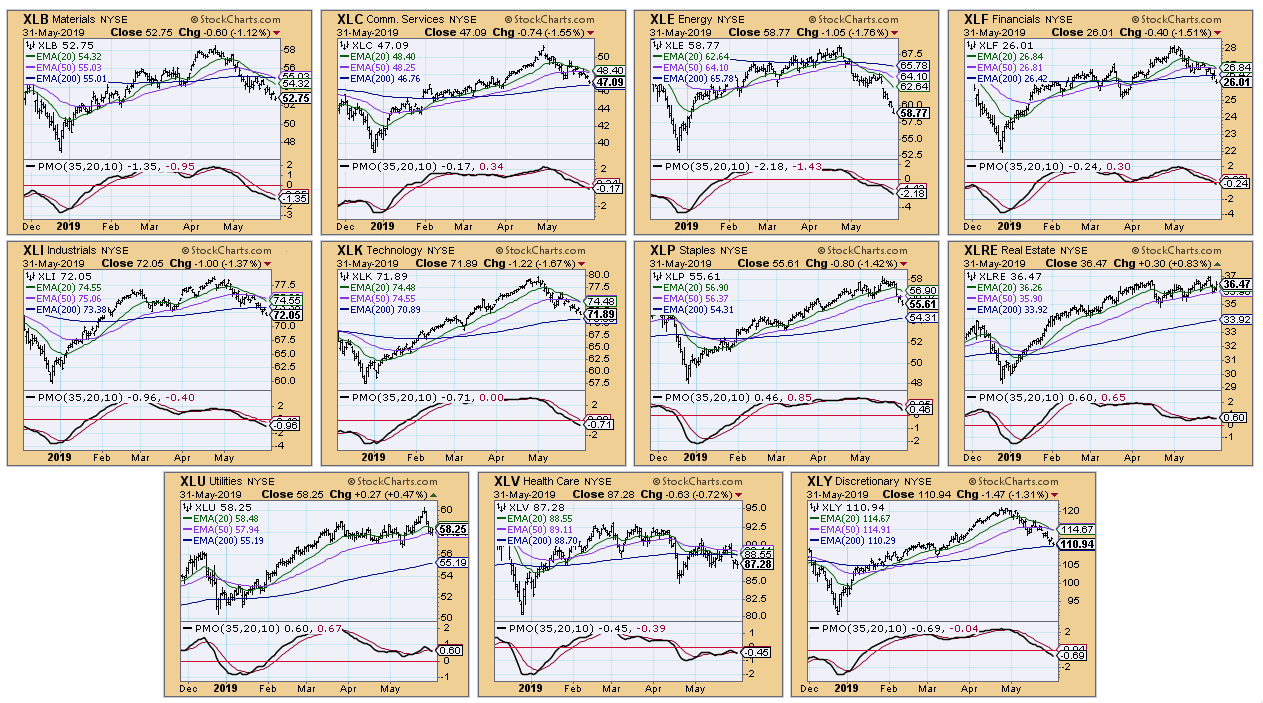
Conclusion: Indicators do not suggest a price reversal at this time. Take a look at the 20/50-EMAs on the SPDRs. We just logged ITTM Neutral signals for both XLK and XLY (aggressive sectors). The other sectors, including defensive sectors, are all headed for the same. Below is a CandleGlance. We are in correction mode now, and I don't see a price reversal on the horizon at this point.
Watch the latest episode of DecisionPoint with Carl & Erin Swenlin LIVE on Fridays 4:30p EST or on the StockCharts TV YouTube channel here!
Technical Analysis is a windsock, not a crystal ball.
Happy Charting!
- Erin
erinh@stockcharts.com
Helpful DecisionPoint Links:
DecisionPoint Shared ChartList and DecisionPoint Chart Gallery
Price Momentum Oscillator (PMO)
Swenlin Trading Oscillators (STO-B and STO-V)
**Don't miss DecisionPoint Commentary! Add your email below to be notified of new updates"**


