My dad, Carl Swenlin, was a guest on MarketWatchers LIVE last Wednesday (here is a link to that show). He brought in some DecisionPoint indicator charts that I hadn't looked at in quite some time (truth be told, he hadn't looked at them in awhile either) and many of our viewers asked about how to obtain them. One of the ChartLists in the DecisionPoint Market Indicators ChartPack is labeled "Volume Ratios" - it's actually a very elegant indicator in its simplicity. What surprised us both was the timeliness of the attention flags that the climactic readings presented.
Here are the charts that Carl brought to the show:
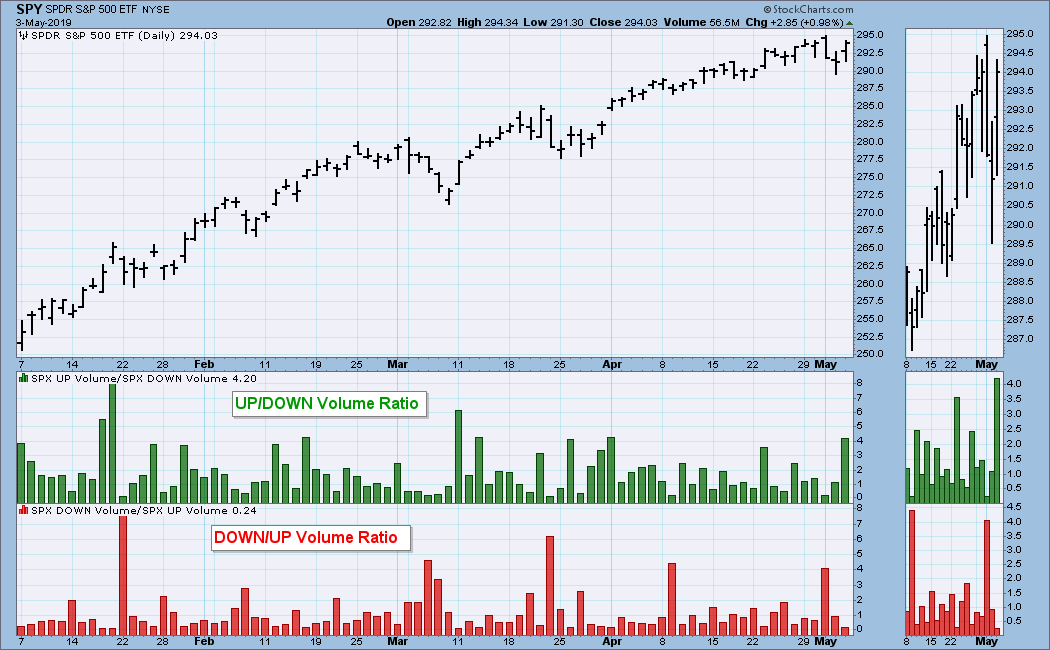
Below, we have a very-short-term chart of the ratios. Basically, the ratios are total Up volume divided by Down volume and vice versa. We can see peaks here, but they aren't really as climactic as they might seem. It is far more obvious on longer-term charts what a climactic reading really is.
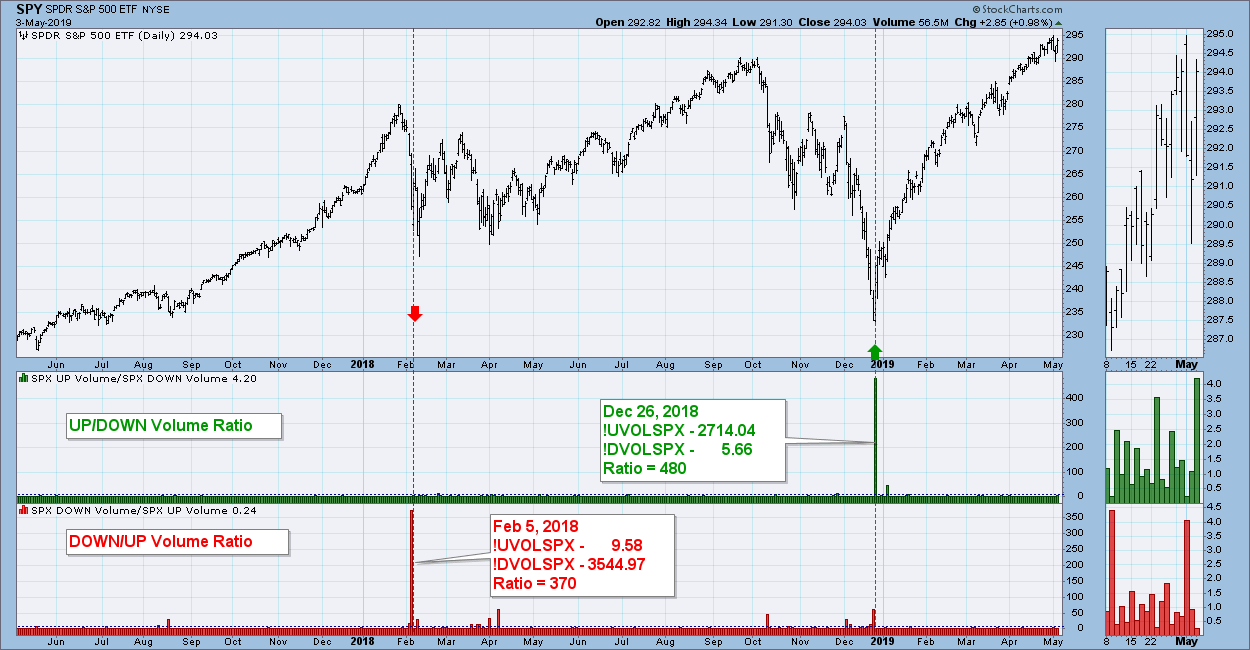
You can see that, in Carl's annotations, the readings are very climactic. Compare the ratios. The short-term chart above shows ratios that are less than 5.0. The chart below shows climactic readings above 370!
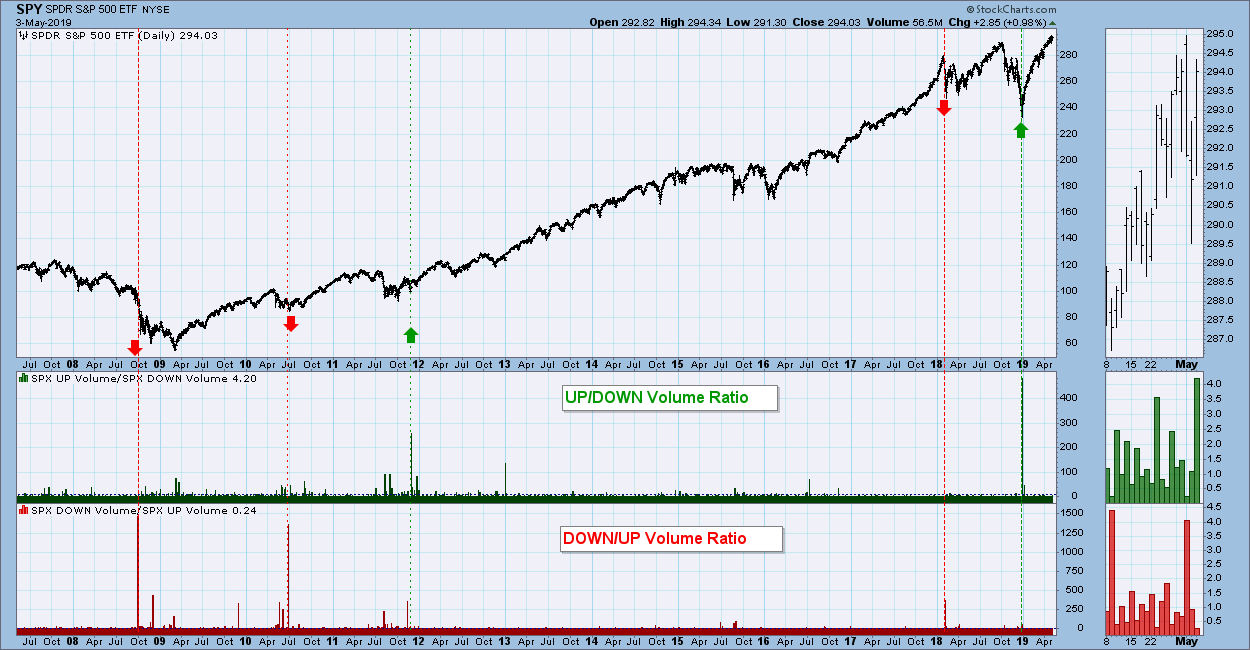
Below is an even longer-term chart. Note that the extraordinarily climactic readings tend to arrive on point.
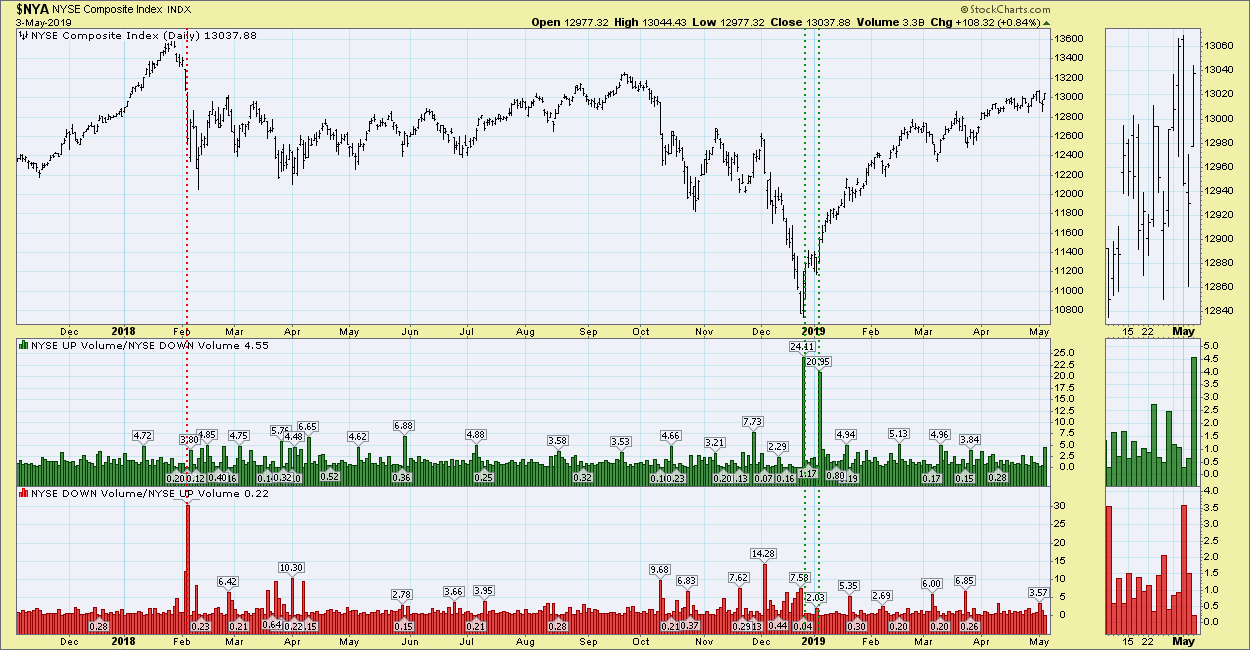
Below is a shorter-term chart of the NYSE's volume ratios. Readings above 20 have had significance in relation to price bottoms and last year's top.
Conclusion: If you are interested in downloading the DecisionPoint Market Indicator ChartPack, instructions are here. For Basic members, you can click on the charts above to save them to your ChartList.
Watch the latest episode of DecisionPoint with Carl & Erin Swenlin LIVE on Fridays 4:30p EST or on the StockCharts TV YouTube channel here!
Technical Analysis is a windsock, not a crystal ball.
Happy Charting!
- Erin
erinh@stockcharts.com
Helpful DecisionPoint Links:
DecisionPoint Shared ChartList and DecisionPoint Chart Gallery
Price Momentum Oscillator (PMO)
Swenlin Trading Oscillators (STO-B and STO-V)
**Don't miss DecisionPoint Commentary! Add your email below to be notified of new updates"**


