 Breakouts are bullish and often look great, but they do not always offer the best reward-to-risk ratio when taking a trade. As with so many aspects of technical analysis and trading, we must often walk the fine line between anticipation and confirmation. The first step to anticipating a breakout is spotting a reversal alert zone before the breakout occurs. Going on alert before the breakout can improve the entry price and the reward-to-risk ratio.
There are three parts to a reversal alert zone. First, the decline leading to the reversal zone should be considered a correction after some sort of impulse move. An impulse move is deemed part of the primary uptrend and subsequent declines are viewed as corrective or secondary price movements. In other words, I am interested in a reversal that will signal a continuation of the bigger uptrend.
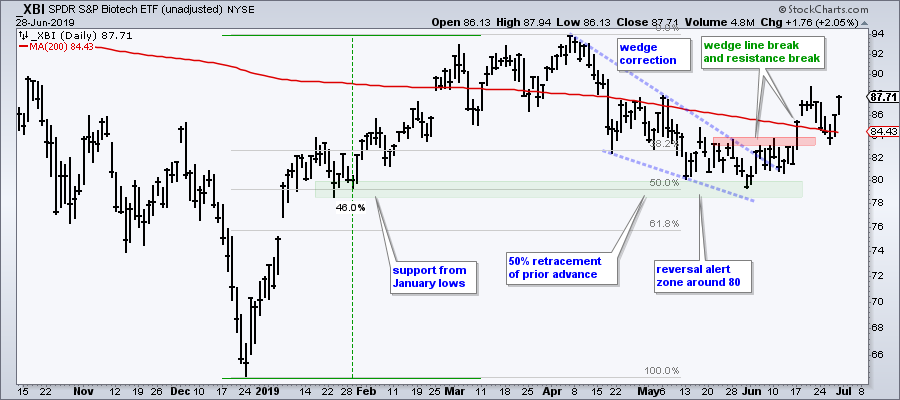
Second, the decline should retrace one third to two thirds of the prior advance. Charles Dow used 33.3% and 66.7% as retracement estimates with 50% as the based case. Elliott wavers use 38.2% and 61.8%. Personally, I raise the alert level when a decline retraces around 50% of the prior advance, which is akin to two steps forward (up) and one step back (down). The chart below shows XBI retracing around 50% of its prior advance, which was a whopping 46%. Note that this reversal alert zone was visible in mid June (Art's Charts article)
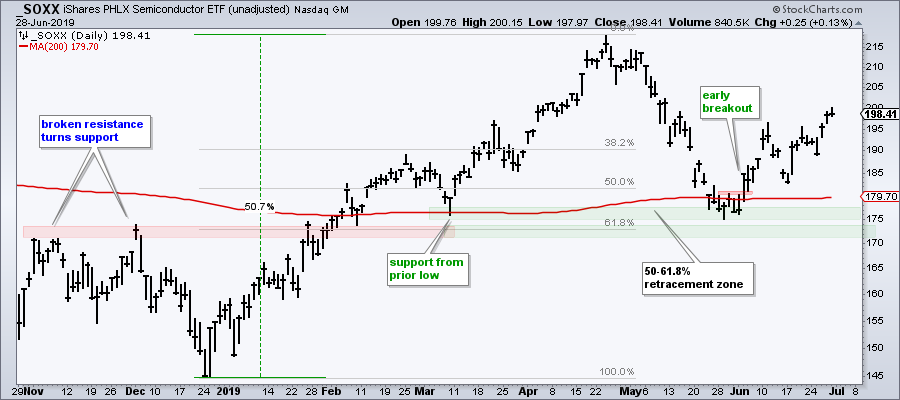
Third, the retracement zone should be confirmed by a support area. This could be broken resistance turning into support, a prior consolidation or even prior lows that marked support. The chart below shows SOXX finding support near the early March low and just above support from broken resistance (green zones). In addition, the decline into late May retraced 50-61.8% of the prior advance. This reversal zone was visible in late May (Art's Chart Article)
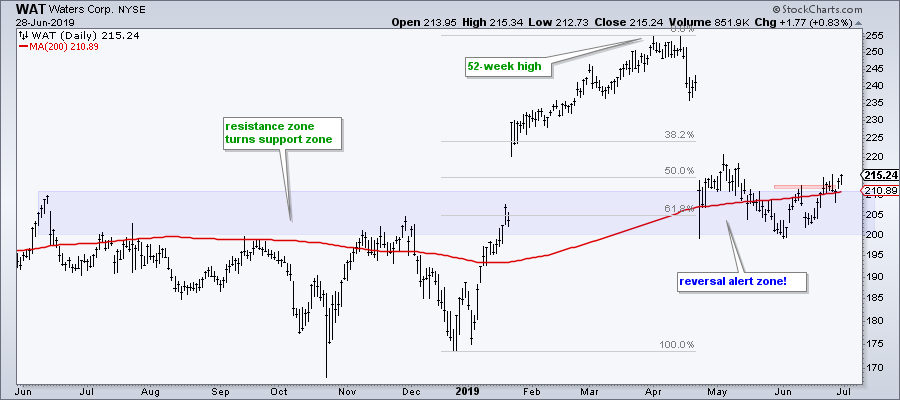
Reversal alert zones are certainly not fool proof, but they offer a great reward-to-risk ratio when they do work. Chartists watching these reversal alert zones for SOXX and XBI could have nibbled in the support zones or jumped on the first sign of a breakout. As far as current reversal alert zones, Waters Corp (WAT) caught my eye as it returned to a breakout zone and retraced around two thirds of the prior advance. The stock firmed in the 200-205 area from April to mid June and turned up the last two weeks.
On Trend on YouTube (Thursday, June 27th)
- Setups versus Breakouts (IBB, ASHR, SOXX)
- Spotting a Reversal Alert Zone
- A Video Game Stock Sets Up Bullish
- A Defense Stock Bouncing off Support
- Click here to Watch
Arthur Hill, CMT
Senior Technical Analyst, StockCharts.com
Author, Define the Trend and Trade the Trend
Want to stay up to date with the latest market insights from Arthur?
– Follow @ArthurHill on Twitter
– Subscribe to Art's Charts
– Watch On Trend on StockCharts TV (Tuesdays / Thursdays at 10:30am ET)


