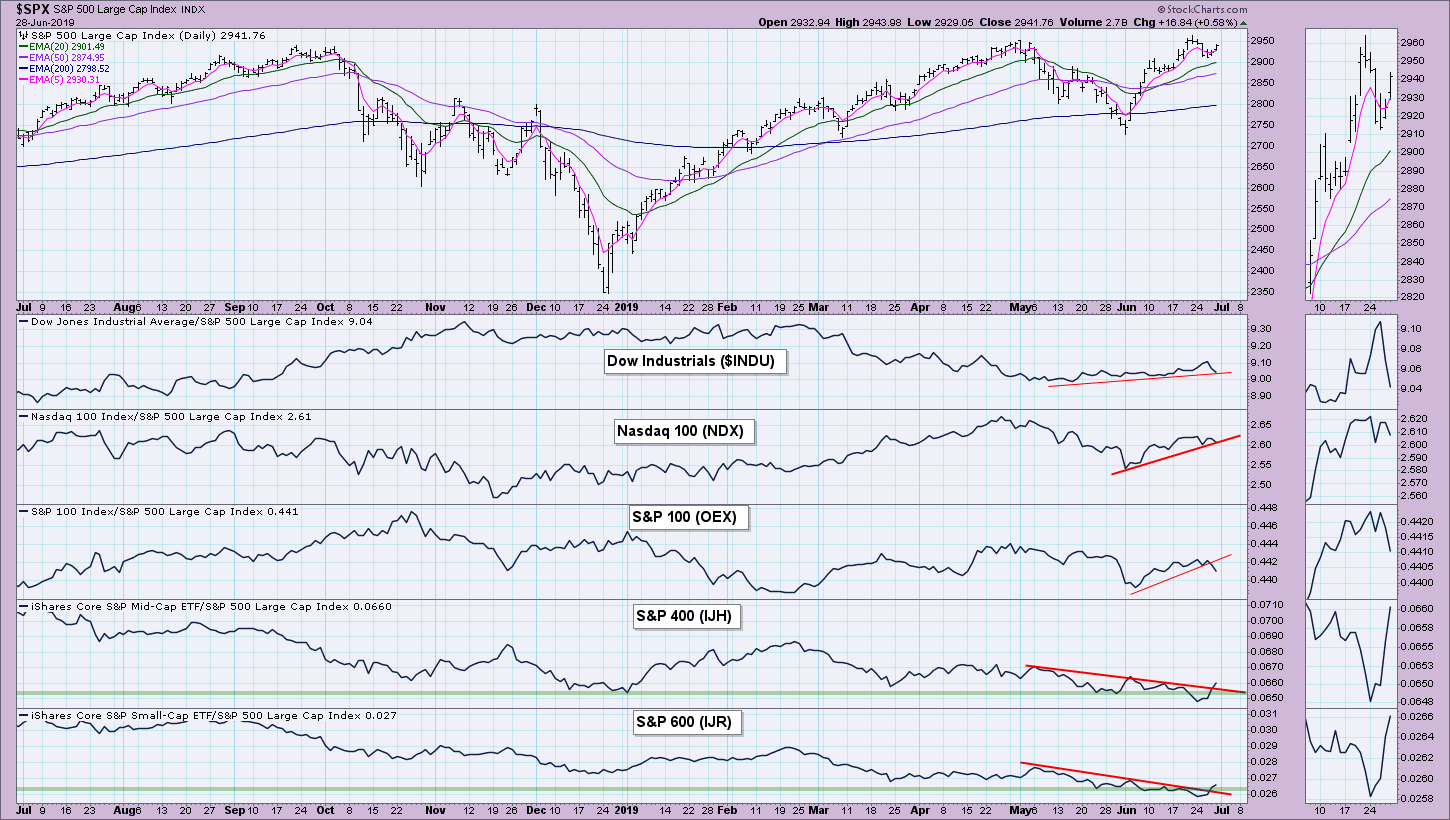
Be prepared! I have a plethora of charts this week to share that focus only on the S&P 600. If you look closely, you can see that, even before the last two days of an impressive rally, the indicators were already suggesting a renewed interest in small-cap stocks. Below is the relative chart of the major indexes to the SPX. Note that we are seeing an increase in relative strength for the S&P 400 and S&P 600 after logging relative lows that we hadn't seen all year.
I'm going to introduce you to all of the charts that are in our free ChartPack called "Straight Shots." I'll be using the DPSS-1300 ChartList, which provides you with all of the indicators below that are specifically calculated for the S&P 600. Here is the listing:
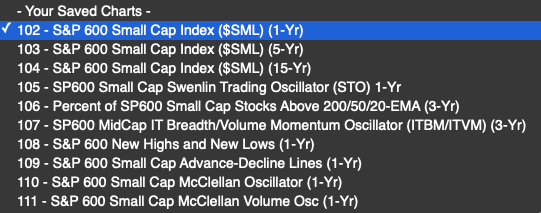
We have these same indicator sets for the other major indexes, including the S&P 400, Dow, etc.
As you can see, there was a nice breakout today for the small-caps. Additionally, price broke above the 200-EMA. We are still waiting for the 20-EMA to cross above the 50-EMA for an IT Trend Model BUY signal, as well as for the 50-EMA to cross above the 200-EMA for a LT Trend Model BUY signal. Don't get too excited by today's volume - it was quarterly options expiration day. I do note that, even if we get a decline on Monday, the OBV top will be above the previous top, which is confirming.
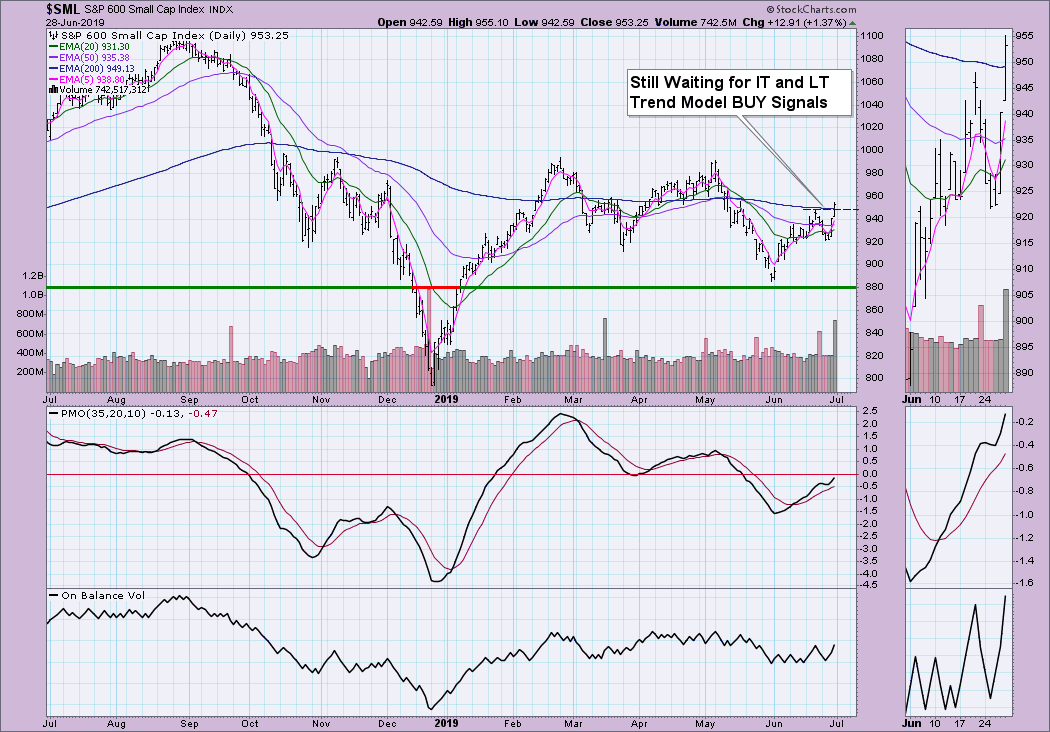
We nearly saw an IT Price Momentum Oscillator (PMO) BUY signal this week. It should come in next week, barring a correction.
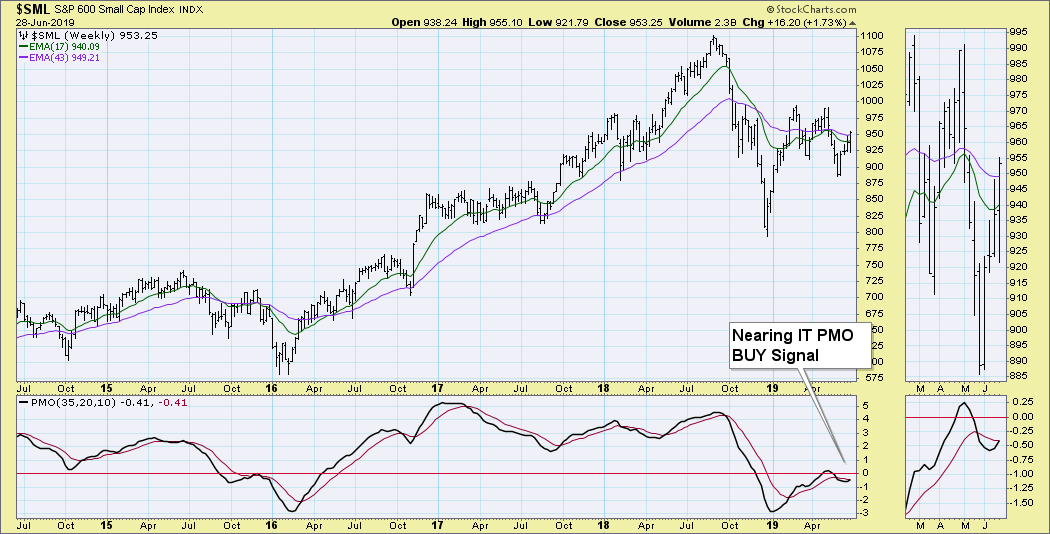
We are still seeing a declining PMO on the monthly chart and a long-term declining tops line that still hasn't been broken.
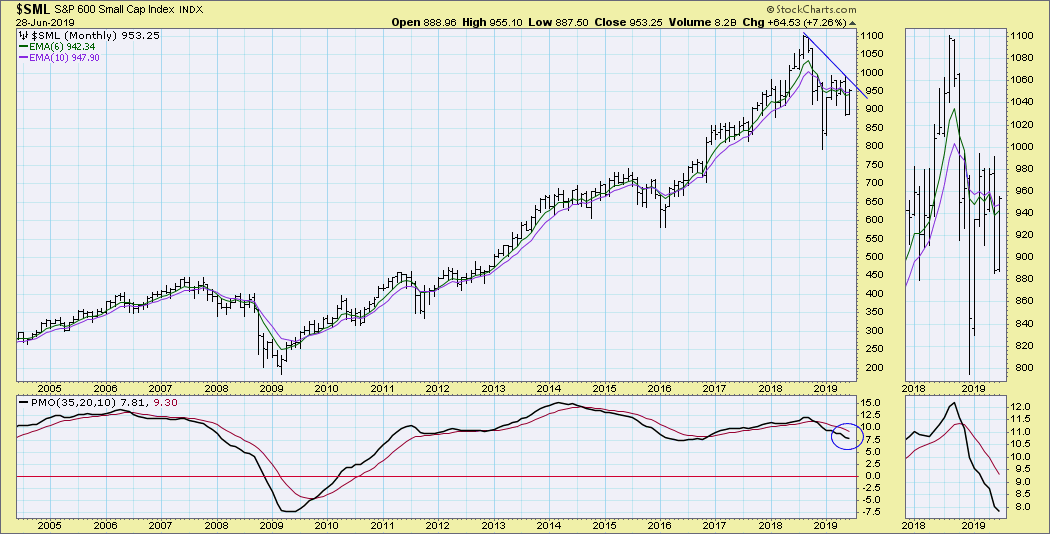
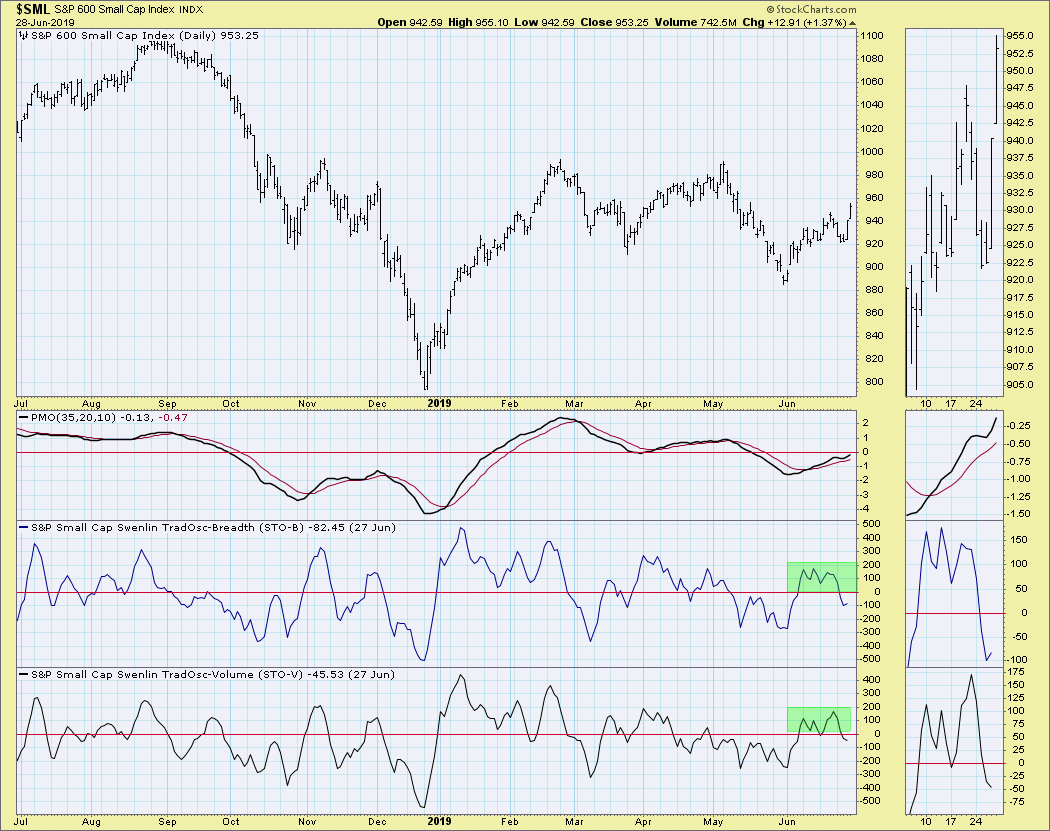
I like that the Swenlin Trading Oscillators (STOs) have ticked up after moving just below the zero line. They are currently in neutral territory and can definitely accommodate higher prices before becoming overbought.
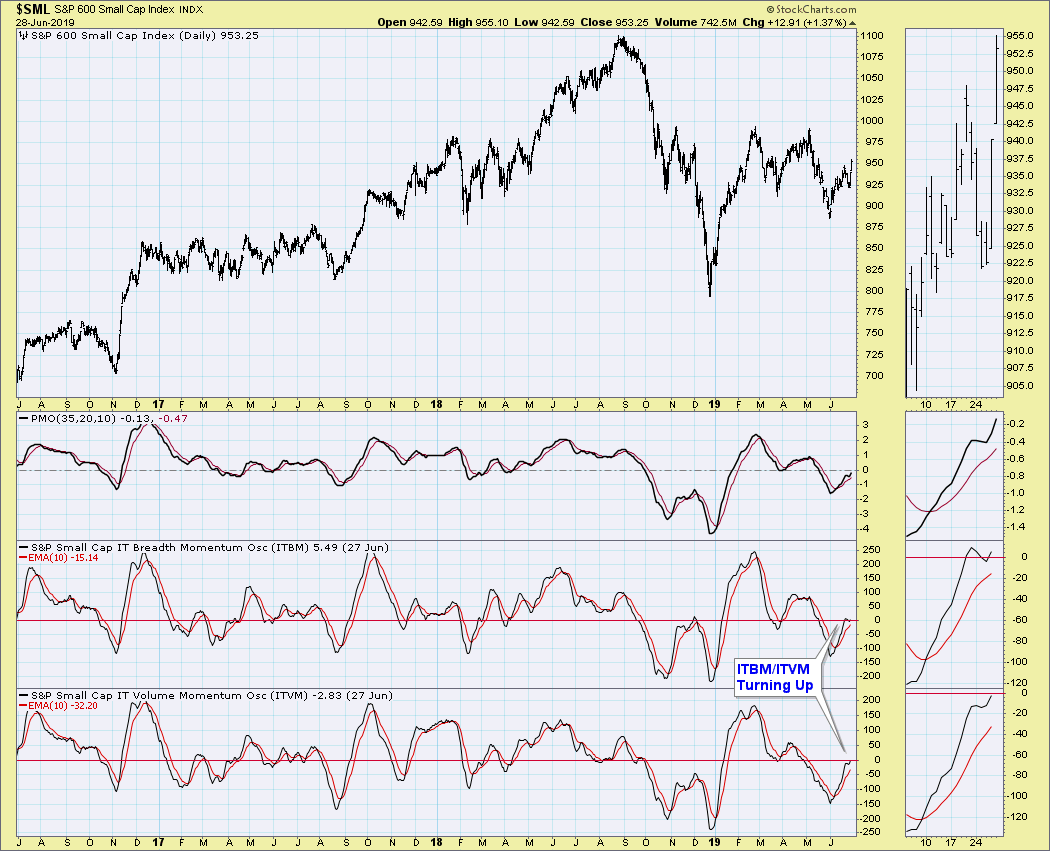
Like the SPX, ITBM and ITVM for the S&P 600 had previously topped, but they turned up yesterday. They are also in neutral territory.
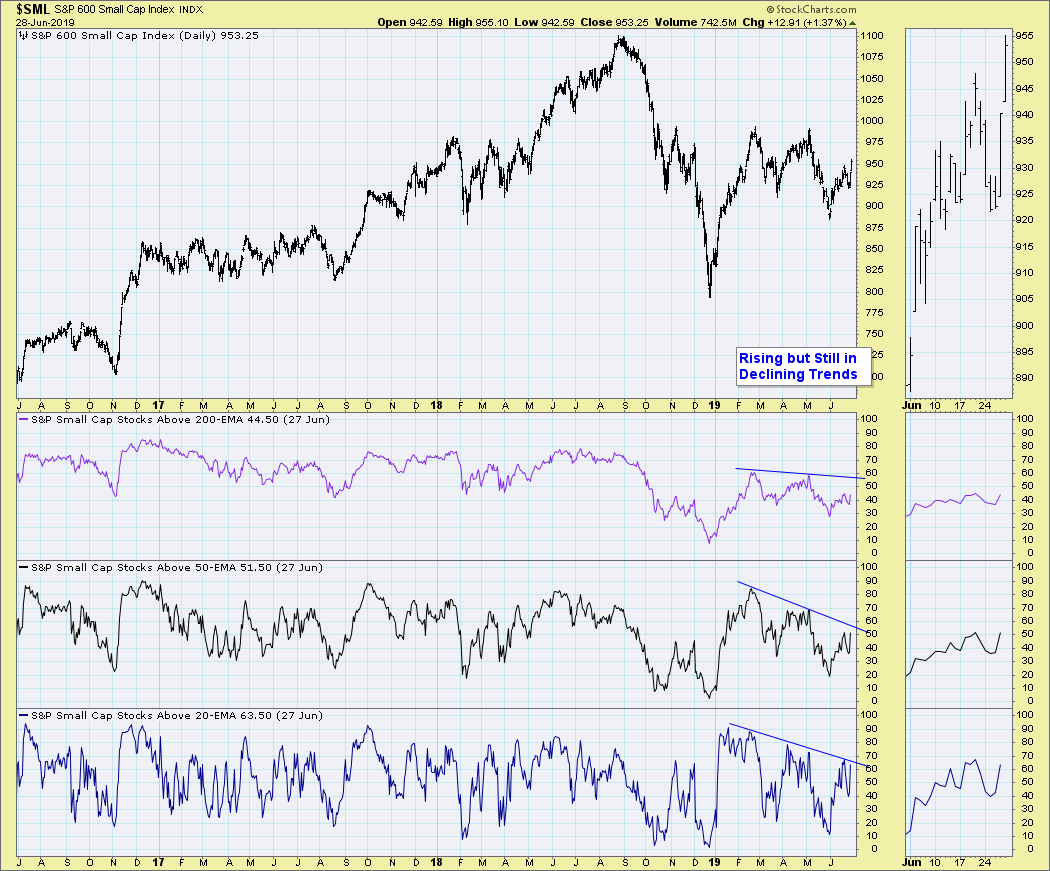
Stocks above their various moving averages for the $SML are improving, but are still within a declining trend. They have plenty of room for improvement.
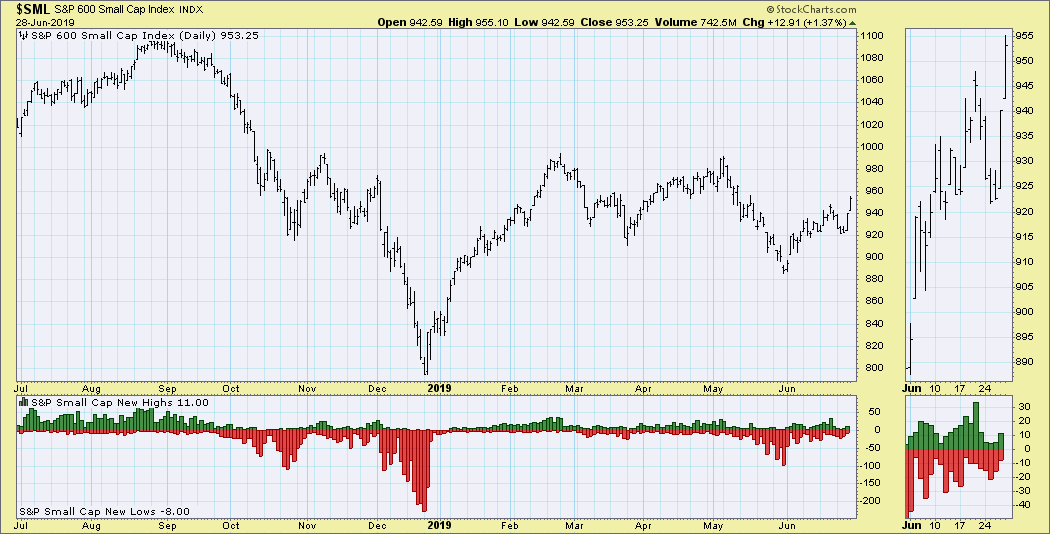
We didn't see any climactic activity this week on the New Highs/New Lows chart.
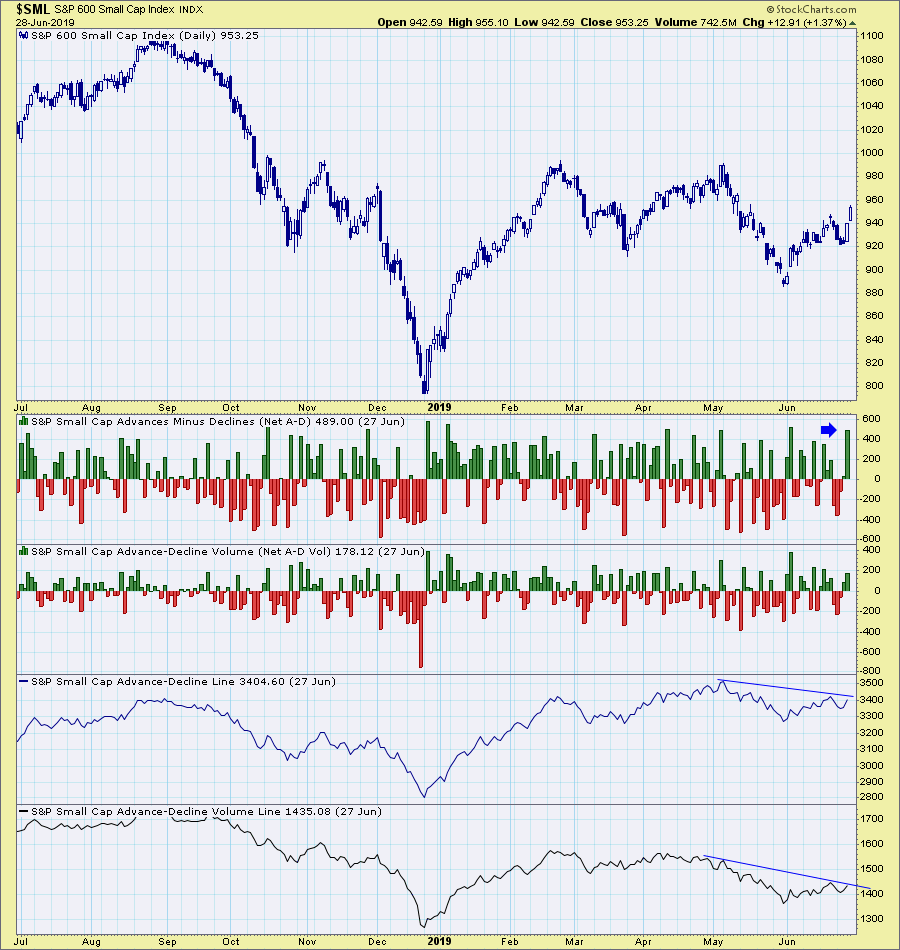
However, we did see extremely climactic readings on the Net Advances - Declines. The volume indicator didn't participate climactically, which I don't like. Also, we can see that the AD Lines are still in a declining trend, but are now vulnerable to a breakout.
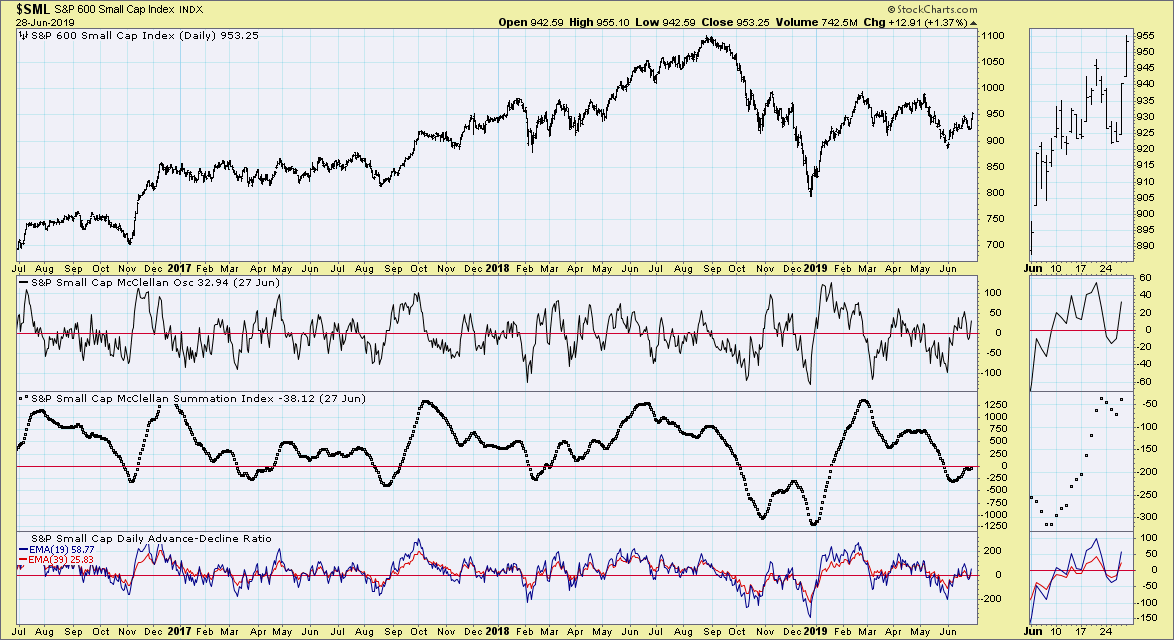
Finally, looking at the McClellan Oscillator chart for the $SML, we saw a move back above the zero line for the oscillator. However, the Summation Index is stuck below the zero line.
Conclusion: By reviewing all of the indicators in the DPSS - 1300 ChartList from the DP Straight Shots free ChartPack, we can see that indicators were already hinting at a recovery for the small-caps and we are beginning to see that recovery in action. I'm very encouraged, given a multi-year relative low and the bounce that is now occurring. I recommend that you click on the charts above for "live" versions. I suspect the new readings that will come in this weekend will bolster my case that the small-caps are now waking and should continue to outperform. Consider downloading the DP Straight Shots ChartPack if you'd like to focus in on the other major indexes.
Watch the latest episode of DecisionPoint with Carl & Erin Swenlin LIVE on Fridays 4:30p EST or on the StockCharts TV YouTube channel here!
Technical Analysis is a windsock, not a crystal ball.
Happy Charting!
- Erin
erinh@stockcharts.com
Helpful DecisionPoint Links:
DecisionPoint Shared ChartList and DecisionPoint Chart Gallery
Price Momentum Oscillator (PMO)
Swenlin Trading Oscillators (STO-B and STO-V)
**Don't miss DecisionPoint Commentary! Add your email below to be notified of new updates"**


